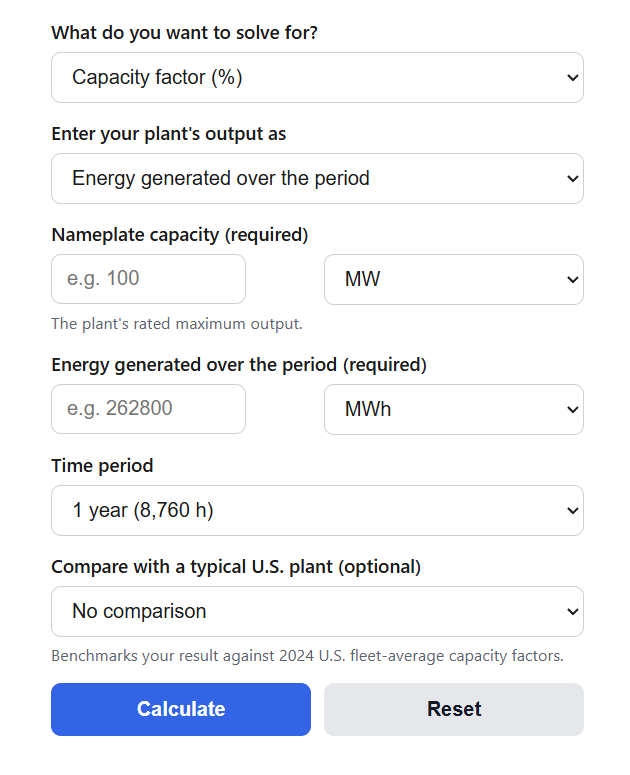
Calculate a power plant’s capacity factor from nameplate capacity and energy generated, or solve for expected energy output and required capacity in MW and MWh.
Power Plant Capacity Factor Formula
The capacity factor compares the energy a plant actually generated with the energy it could have generated if it had run at its full nameplate rating for the entire period:
CF = E / (P * t) * 100
The calculator rearranges the same relationship for its other two modes. To predict energy output from a known capacity factor:
E = (CF / 100) * P * t
To size the nameplate capacity needed to hit an energy target:
P = E / ((CF / 100) * t)
Variables:
- CF is the capacity factor, expressed as a percent
- E is the energy generated, or needed, over the period, in megawatt-hours (MWh)
- P is the nameplate capacity of the plant, in megawatts (MW)
- t is the number of hours in the period: 8,760 for a year, 730 for an average month, 168 for a week, 24 for a day
Pick what you want to solve for at the top of the calculator. In capacity factor mode you can enter the plant’s output either as total energy generated or as an average power output, and the tool returns the capacity factor along with equivalent full-load hours, downtime-equivalent hours, and average power. The other two modes predict energy production from an assumed capacity factor or size the capacity required to meet an energy target. The optional comparison setting benchmarks your result against 2024 U.S. fleet-average capacity factors so you can see how the plant stacks up against a typical plant of the same type.
Average Capacity Factors by Plant Type
These are the 2024 U.S. fleet-average capacity factors for utility-scale generators, based on federal Energy Information Administration (EIA) generation and capacity data, along with the equivalent full-load hours each average works out to over a year. Equivalent full-load hours are the number of hours the plant would need to run at full nameplate output to produce the same energy.
| Plant type | 2024 U.S. average capacity factor | Equivalent full-load hours per year |
|---|---|---|
| Nuclear | 92% | 8,060 |
| Geothermal | 67% | 5,870 |
| Natural gas combined cycle | 59% | 5,170 |
| Coal (steam turbine) | 43% | 3,770 |
| Conventional hydropower | 35% | 3,070 |
| Onshore wind | 34% | 2,980 |
| Utility-scale solar PV | 23% | 2,010 |
| Natural gas peaker (combustion turbine) | 12% | 1,050 |
Use the next table to read your result. The right interpretation depends on the role the plant plays on the grid, not just the raw number.
| Capacity factor | What it usually indicates |
|---|---|
| 90% and above | Baseload operation with minimal downtime, typical of nuclear and well-run geothermal plants |
| 50% to 90% | Load-following or mid-merit operation, common for combined cycle gas plants that ramp with demand |
| 25% to 50% | Resource-limited generation such as wind and hydro, or fossil plants dispatched only part of the time |
| Below 25% | Solar plants limited by daylight hours, or peaker plants that are intentionally run only during demand spikes |
Example Problems
Example 1: A wind farm has a nameplate capacity of 100 MW and generates 262,800 MWh over a full year. The maximum possible output is 100 MW times 8,760 hours, which is 876,000 MWh. Dividing actual output by maximum output gives 262,800 / 876,000 = 0.30, so the capacity factor is 30%. That corresponds to 2,628 equivalent full-load hours and an average power output of 30 MW, about 4 percentage points below the 2024 U.S. onshore wind average.
Example 2: You need a solar site to deliver 50,000 MWh per year and expect a 23% capacity factor. The required nameplate capacity is P = 50,000 / (0.23 * 8,760) = 50,000 / 2,014.8 = 24.82 MW. Entering the same numbers in capacity mode returns 24.82 MW, so you would plan for roughly a 25 MW installation.
Frequently Asked Questions
Is capacity factor the same as efficiency or availability?
No. Efficiency measures how much of the input fuel energy becomes electricity, so a coal plant can be 35% efficient while running at a 70% capacity factor. Availability factor measures the share of hours the plant was able to run, whether or not it actually did. A gas peaker can be available 95% of the time but post a 12% capacity factor because the grid only calls on it during demand spikes. Capacity factor only compares energy delivered with the nameplate maximum over the clock hours in the period.
Can a capacity factor be higher than 100%?
It can happen over short periods when a plant’s actual output exceeds its nameplate rating, for example when cold ambient temperatures let a gas turbine produce more than its rated capacity. Over a full year a value above 100% almost always means an input error, such as mixing kWh with MWh or using the wrong number of hours. The calculator flags any result above 100% so you can check the inputs.
Does a low capacity factor mean the plant is performing badly?
Not by itself. Peaker plants are designed to sit idle most of the year, solar output is capped by daylight hours, and wind plants may be curtailed when the grid cannot absorb their output. Judge a capacity factor against the fleet average for the same technology, which is what the comparison option in the calculator does. A nuclear plant at 75% would be well below its 92% fleet average and worth investigating, while a solar plant at 25% is slightly beating its typical value.