Calculate price-to-rent ratio from property price and monthly or annual rent, including multi-unit income and target rent needed for rentals.
- All Rent Calculators
- All Personal Finance Calculators
- Rent To Value Calculator
- Rent Vs Sell Calculator
- Rent Per Sq Ft Calculator
- Square Foot Rent Calculator
- Rent Increase Calculator
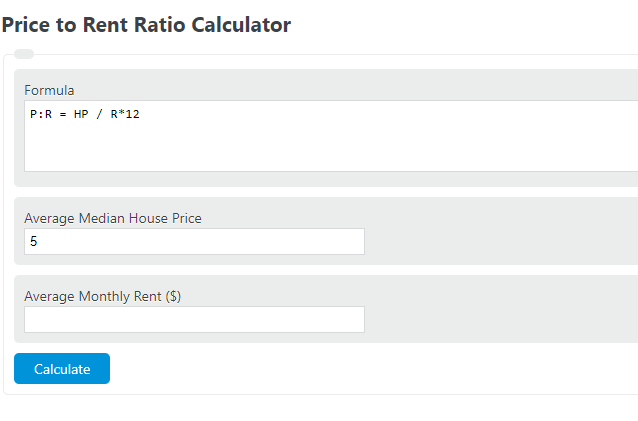
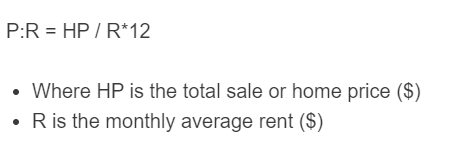
Price to Rent Ratio Formula
The price-to-rent ratio compares a property’s price to the gross annual rent it produces. A lower ratio means rent is high relative to price. A higher ratio means price is high relative to rent.
- Property Price: the purchase price or current market value.
- Annual Gross Rent: total rent collected in one year before expenses, vacancy, or taxes.
If you only have monthly rent, multiply by 12 first. The ratio uses gross rent, not net operating income, so it does not account for taxes, insurance, maintenance, or vacancy. Use it as a screening tool, not a final investment decision.
Two related figures the calculator also reports:
If the 1% rule check is at or above 1%, monthly rent meets or exceeds 1% of the price.
Calculator modes:
- Quick Ratio: enter price and rent (monthly or annual). The calculator converts rent to annual and divides price by it.
- Multi-Unit: enter price, per-unit monthly rent, unit count, and optional other income. Total monthly income is (rent per unit × units) + other income, then annualized.
- Target Rent: enter price and a target ratio. The calculator solves for the monthly rent needed using target monthly rent = price / target ratio / 12. If you supply actual rent, it shows the gap.
Reference Tables
Use these as rough benchmarks. Local taxes, HOA fees, and insurance can shift the picture.
| Ratio | Interpretation | Typical Signal |
|---|---|---|
| Under 15 | Buyer-friendly | Buying often beats renting; better cash-flow potential. |
| 15 to 20 | Balanced | Buying and renting are close on a gross basis. |
| Over 20 | Renter-friendly | Renting usually costs less than owning; cash flow gets tight. |
| Price | Monthly Rent for Ratio = 15 | Monthly Rent for Ratio = 20 | 1% Rule Rent |
|---|---|---|---|
| $200,000 | $1,111 | $833 | $2,000 |
| $350,000 | $1,944 | $1,458 | $3,500 |
| $500,000 | $2,778 | $2,083 | $5,000 |
| $750,000 | $4,167 | $3,125 | $7,500 |
| $1,000,000 | $5,556 | $4,167 | $10,000 |
Worked Examples and FAQ
Example 1: Single-family rental. Price is $350,000. Monthly rent is $2,200. Annual rent is $26,400. Ratio = 350,000 / 26,400 = 13.26. That falls in the buyer-friendly range. Gross yield is 7.54%. Monthly rent is 0.63% of price, so it fails the 1% rule.
Example 2: Fourplex. Price is $850,000. Each of 4 units rents for $1,600. Monthly income is $6,400. Annual rent is $76,800. Ratio = 850,000 / 76,800 = 11.07. Gross yield is 9.04%, and rent equals 0.75% of price.
Example 3: Target rent. Price is $400,000 and you want a ratio of 15. Target annual rent = 400,000 / 15 = $26,667. Target monthly rent = $2,222. If actual rent is $1,900, you are $322 per month below target, and the actual ratio is 17.54.
Is a lower ratio always better? For a buyer or investor, lower usually means better cash flow. But very low ratios can signal weak demand, declining neighborhoods, or high property tax burdens. Look at the area and condition, not just the number.
Should I use gross or net rent? The standard price-to-rent ratio uses gross rent. If you want a measure that includes expenses, use cap rate or cash-on-cash return instead.
How does this differ from the 1% rule? The 1% rule checks if monthly rent is at least 1% of price. A property meeting the 1% rule has a price-to-rent ratio near 8.3. The 1% rule is a stricter screen than a ratio under 15.
Does the ratio decide rent vs. buy? It is a starting point. Mortgage rates, down payment, property taxes, HOA fees, insurance, maintenance, and how long you plan to stay all affect the real answer.