Calculate return on revenue, expenses, or total revenue from any two values and find the missing profitability figure for your business.
- All Business Calculators
- Return on “X” Calculators
- Return on Energy Invested Calculator
- Return on Cost Calculator
Return on Revenue Formula and Interpretation
Return on revenue measures the percentage of revenue left after expenses are subtracted. It is a quick profitability ratio for judging pricing, cost control, and operating efficiency. When all expenses are included, it functions like a profit-margin style measure; when only selected costs are included, treat it as a partial margin.
| Variable | Meaning |
|---|---|
| ROR | Return on Revenue (%) |
| TR | Total Revenue |
| E | Total Expenses |
How to Calculate Return on Revenue
- Choose one reporting period, such as a week, month, quarter, or year.
- Enter total revenue for that same period.
- Enter total expenses for that same period.
- Subtract expenses from revenue to find profit, then divide by revenue and multiply by 100.
A positive result means the business kept part of its revenue as profit. A value of 0% means break-even. A negative result means expenses were greater than revenue.
Interpretation Guide
| Return on Revenue | General Reading |
|---|---|
| Above 20% | Strong margin in many situations; compare against your industry and business model. |
| 10% to 20% | Healthy margin for many businesses. |
| 0% to 10% | Thin margin; small changes in pricing or costs can have a large impact. |
| 0% | Break-even; revenue exactly covers expenses. |
| Below 0% | Loss; expenses exceed revenue. |
Reverse Calculations
If you know the target return on revenue and revenue, you can estimate the maximum expenses allowed:
If you know the target return on revenue and expenses, you can estimate the required revenue:
This rearranged revenue formula is only meaningful when the denominator is greater than 0.
Example Results
| Total Revenue | Expenses | Profit | Return on Revenue |
|---|---|---|---|
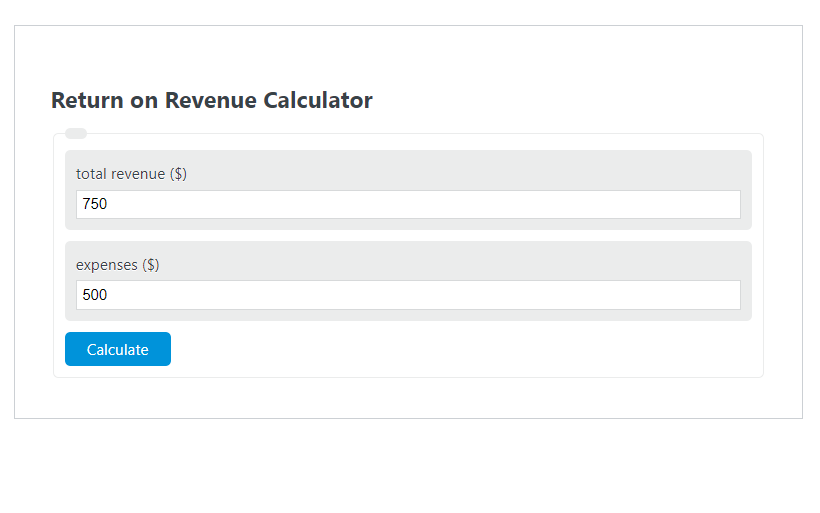
| $750 | $500 | $250 | 33.33% |
| $185 | $123 | $62 | 33.51% |
| $1,200 | $1,200 | $0 | 0% |
| $1,000 | $1,080 | -$80 | -8% |
Common Input Rules
| Rule | Why It Matters |
|---|---|
| Use the same time period for both numbers | Monthly revenue and annual expenses should never be mixed. |
| Keep expense scope consistent | Comparisons only work when you include the same categories each time. |
| Avoid double-counting costs | Duplicate expense entries make the ratio look worse than it really is. |
| Revenue must be greater than zero | The ratio cannot be calculated when total revenue is 0. |
What Counts as Expenses?
That depends on the purpose of your analysis. The key is consistency. If you change what is included, the percentage may no longer be comparable from one period to the next.
| Expense Category | Usually Included? | Notes |
|---|---|---|
| Cost of goods sold | Often | Useful for product-level or gross-style profitability views. |
| Payroll and contractor costs | Often | Important for service businesses and operating margin analysis. |
| Rent, software, utilities | Often | Common overhead items that affect operating performance. |
| Interest and taxes | Sometimes | Include them only if your goal is full bottom-line profitability. |
| One-time charges | Case-by-case | Exclude if you want a cleaner view of normal operations. |
How to Improve Return on Revenue
- Increase average selling price where demand supports it.
- Reduce variable costs such as materials, shipping, or commissions.
- Trim fixed overhead that does not directly support growth.
- Shift sales toward higher-margin products or services.
- Review discounting, refunds, and waste.
- Track the ratio over time instead of relying on a single period.
Quick Questions
- Is a higher return on revenue better?
- Yes. A higher percentage means more profit is retained from each dollar of revenue.
- Can return on revenue be negative?
- Yes. Negative values mean expenses were greater than revenue for the selected period.
- Is this the same as ROI?
- No. Return on revenue measures profit relative to revenue, while ROI measures profit relative to an investment.
- Why compare this ratio across multiple periods?
- Trend analysis helps you see whether pricing, cost structure, and operational efficiency are improving or declining.