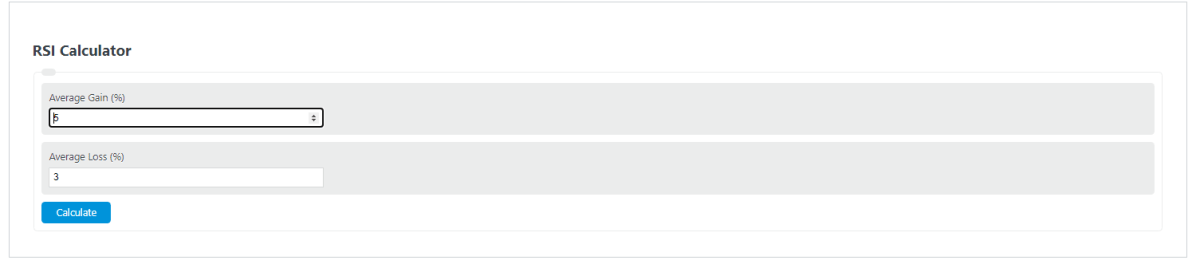
Enter the average gain and loss into the calculator to determine the relative strength index (RSI).
- Reverse Stock Split Calculator
- ROI Calculator – Return on Investment
- Income Investing Calculator
- VWAP (Volume Average Weighted Pricing) Calculator
- MACD Calculator
- Maximum Drawdown Calculator
- Portfolio Margin Calculator
RSI Formula
The following formula is used to calculate a relative strength index (RSI).
RSI = 100 - (100 / ( 1+RS))
- Where RSI is the relative strength index
- RS is the relative strength
RS = AG/ AL
- Where AG is the average gain (%)
- AL is the average loss (%)
RSI Definition
RSI, short for relative strength index, is a metric used in finance to indicate “momentum” within the stock market or another asset.
This “momentum” indicator is used to determine if an asset is currently overbought or oversold. RSI values of greater than 70 will be considered overbought and under 30 means the asset could be undervalued.
Example Problem
How to calculate RSI?
- First, determine the average gain over the previous 14 day period.
For this example, the average gain is 5%.
- Next, determined the average loss over the same 14 day period on days with losses.
For this problem, the average loss is 3%. Losses are kept positive for the RSI calculation.
- Finally, calculate the RSI.
The relative strength index is calculated using the formula above:
RSI = 100 – (100 / ( 1+RS))
RSI = 100 – (100 / ( 1+(AG/AL))
RSI = 100 – (100 / ( 1+5/3) )
RSI = 62.5
This would indicate the asset is moving towards an overvalued position.