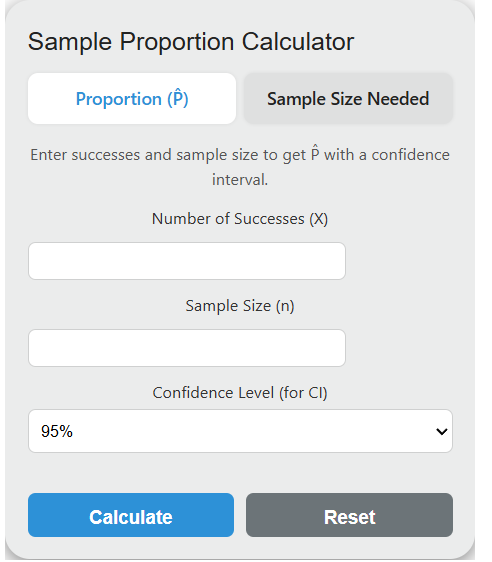
Calculate sample proportion and confidence interval from successes and sample size, plus required sample size from margin of error.
Related Calculators
- Percentage to Frequency Calculator
- Bayes Theorem Calculator
- Central Limit Theorem Calculator
- Completion Ratio Calculator
- Hit Ratio Calculator
- Defect Rate Calculator
- All Statistics Calculators
Sample Proportion Formula
The sample proportion is calculated using a straightforward ratio:
Where P̂ (pronounced “p-hat”) is the sample proportion, X is the count of observed successes, and n is the total number of observations in the sample. The result is always a value between 0 and 1, inclusive. When expressed as a percentage, multiply by 100.
The standard error of the sample proportion, which quantifies sampling variability, is given by:
This standard error shrinks as n increases, which is why larger samples produce more precise estimates. Doubling precision requires quadrupling the sample size.
What is a Sample Proportion?
A sample proportion is a point estimate of the true population proportion (p). Because measuring every member of a population is usually impractical, researchers draw a random sample of size n, count the number of individuals exhibiting the trait of interest (X), and compute P̂ = X/n as their best estimate of p. The distinction matters: p is a fixed but unknown parameter, while P̂ is a statistic that varies from sample to sample.
P̂ is an unbiased estimator of p, meaning the average of all possible sample proportions equals the true population proportion. Its variance decreases with sample size, making P̂ a consistent estimator as well. These two properties are why P̂ is the foundation of nearly all proportion-based inference in statistics.
Sampling Distribution of P̂
When you repeatedly draw random samples of size n from a population with true proportion p, the collection of all resulting P̂ values forms the sampling distribution of the sample proportion. This distribution has a mean equal to p and a standard deviation (standard error) equal to sqrt(p(1-p)/n).
By the Central Limit Theorem, this distribution is approximately normal when the sample is large enough. The standard normality conditions require both np >= 10 and n(1-p) >= 10. Some textbooks use a threshold of 5, but 10 is the more conservative and widely recommended criterion. When these conditions hold, you can convert P̂ to a z-score using z = (P̂ – p) / sqrt(p(1-p)/n) and use the standard normal table for probability calculations.
For proportions near 0 or 1, the normal approximation breaks down even at moderate sample sizes. In those cases, exact binomial methods or continuity corrections produce more reliable results.
Z-Scores for Common Confidence Levels
The z-score (critical value) determines how wide a confidence interval extends around P̂. Below are exact values for the most commonly used confidence levels:
| Confidence Level | Z-Score (z*) | Two-Tail Alpha |
|---|---|---|
| 80% | 1.2816 | 0.20 |
| 85% | 1.4395 | 0.15 |
| 90% | 1.6449 | 0.10 |
| 95% | 1.9600 | 0.05 |
| 98% | 2.3263 | 0.02 |
| 99% | 2.5758 | 0.01 |
| 99.9% | 3.2905 | 0.001 |
The 95% level is the default in most research disciplines. Medical device regulation (FDA) and pharmaceutical trials often require 99%. Quality control in manufacturing (Six Sigma) uses 99.73%, corresponding to z = 3.00.
Confidence Interval Methods Compared
The calculator above uses the Wald interval (normal approximation), which is the simplest and most commonly taught method. However, several alternative methods exist, each with different coverage properties depending on sample size and the true proportion.
| Method | Formula Basis | Best For | Known Weakness |
|---|---|---|---|
| Wald (Normal Approx.) | P̂ +/- z * SE | Large n, p near 0.5 | Undercoverage when p near 0 or 1, or n < 40 |
| Wilson Score | Inverts the z-test | Small to moderate n, any p | Slightly complex formula |
| Agresti-Coull | Adds 2 successes and 2 failures, then applies Wald | Quick correction for small n | Approximation of Wilson at 95% only |
| Clopper-Pearson (Exact) | Inverts two one-sided binomial tests | Regulatory/conservative settings | Conservative (wider than nominal) |
| Jeffreys | Bayesian with Beta(0.5, 0.5) prior | Small n with p near boundaries | Not strictly frequentist |
Research by Brown, Cai, and DasGupta (2001) demonstrated that the standard Wald interval performs poorly across a wide range of conditions. Their analysis showed the Wilson score and Jeffreys intervals maintain close to nominal coverage even for n as small as 10. The Agresti-Coull method, which simply adds two pseudo-successes and two pseudo-failures before computing the Wald interval, provides a practical improvement with almost no extra computation. For critical applications such as clinical trials or regulatory submissions, the Clopper-Pearson exact interval is preferred because it guarantees at least the stated coverage level.
Sample Size Requirements for Proportion Estimation
The required sample size to estimate a proportion within a margin of error E at confidence level z* is:
When no prior estimate of P̂ is available, use 0.5, which maximizes the product P̂(1 – P̂) and yields the largest (most conservative) sample size. The table below shows required sample sizes at 95% confidence for various margin of error values:
| Margin of Error | n (P̂ = 0.5, worst case) | n (P̂ = 0.2) | n (P̂ = 0.05) |
|---|---|---|---|
| +/- 1% | 9,604 | 6,147 | 1,825 |
| +/- 2% | 2,401 | 1,537 | 457 |
| +/- 3% | 1,068 | 683 | 203 |
| +/- 5% | 385 | 246 | 73 |
| +/- 10% | 97 | 62 | 19 |
Notice how proportions closer to 0 (or 1) require dramatically fewer observations for the same margin of error. A quality control engineer monitoring a 5% defect rate needs only 73 units at +/-5% margin, while a political poll near a 50/50 split needs 385 respondents for the same precision.
Applications Across Industries
Political Polling and Surveys. National election polls typically survey 800 to 1,500 likely voters to achieve margins of error between +/-2.5% and +/-3.5% at 95% confidence. The sample proportion from these polls drives headline forecasts. Pollsters apply post-stratification weighting to adjust P̂ when the sample demographics do not match the population, correcting for nonresponse bias in age, education, and geography.
Clinical Trials and Pharmaceutical Research. In Phase III drug trials, the primary endpoint is often the proportion of patients who respond to treatment versus placebo. The FDA requires pre-specified sample sizes calculated from expected response proportions, and the trial’s success hinges on whether the confidence interval for the treatment-minus-placebo difference excludes zero. Typical trials enroll 300 to 3,000+ patients per arm depending on the expected effect size.
Manufacturing and Quality Control. Acceptance sampling plans use sample proportions to decide whether a production lot meets specifications. A common standard (ANSI/ASQ Z1.4) defines sample sizes and accept/reject numbers based on Acceptable Quality Levels (AQLs). For example, at AQL 1.0% with lot size 1,000, the plan might inspect 80 units and reject the lot if more than 2 are defective (P̂ > 0.025).
A/B Testing in Technology. Web and app companies use sample proportions to compare conversion rates between control and variant groups. A test measuring whether a new checkout flow improves purchase rate from 3.0% to 3.5% (a relative lift of roughly 17%) requires approximately 14,700 users per group at 80% power and alpha = 0.05. These calculations are driven by the same formulas underlying the sample proportion and its standard error.
Epidemiology. Disease prevalence estimates, vaccination coverage rates, and infection fatality ratios are all sample proportions derived from surveillance data or seroprevalence studies. The WHO’s Expanded Programme on Immunization uses cluster sampling of 210 children (30 clusters of 7) to estimate vaccination coverage within +/-10 percentage points.
Hypothesis Testing with Sample Proportions
A one-sample z-test for proportions tests whether a population proportion equals a hypothesized value p0. The test statistic is:
Note that the denominator uses the hypothesized proportion p0 rather than P̂. This is because under the null hypothesis, p0 is assumed to be the true value. The resulting z-score is compared against critical values (e.g., +/-1.96 for a two-tailed test at alpha = 0.05) or used to compute a p-value.
For comparing two independent sample proportions, the pooled proportion P_pooled = (X1 + X2) / (n1 + n2) replaces p0 in the standard error calculation, and the test statistic becomes z = (P̂1 – P̂2) / sqrt(P_pooled(1 – P_pooled)(1/n1 + 1/n2)). This two-sample test is the basis for comparing treatment arms in clinical trials and conversion rates in A/B tests.
Common Pitfalls
Applying the normal approximation when np or n(1-p) is below 10 produces unreliable confidence intervals and test results. Always verify the normality conditions before using z-based methods. For small samples, use the exact binomial test or the Wilson score interval instead.
Using P̂ in the standard error for hypothesis testing (instead of p0) inflates the Type I error rate. The convention is to use p0 in the test statistic and P̂ only for confidence interval construction.
Ignoring finite population correction leads to unnecessarily large sample sizes. When sampling more than 5% of the population without replacement, multiply the standard error by sqrt((N – n) / (N – 1)), where N is the population size. This correction noticeably tightens confidence intervals when n/N exceeds 0.05.
Nonresponse bias can make P̂ misleading even with large n. If the probability of responding is correlated with the outcome of interest, the sample proportion systematically over- or under-estimates the population proportion regardless of sample size.