Calculate y-hat from simple, multiple, or data-based linear regression and find prediction intervals, R², residual error, and confidence intervals.
Related Calculators
- Concordance Index Calculator
- Coverage Factor Calculator
- Type I Error Calculator
- Modified Z Score Calculator
- All Statistics Calculators
Y-Hat Formula
The y-hat (ŷ) value is the predicted response from a simple linear regression line. The calculator uses one of three equivalent forms depending on what you have on hand.
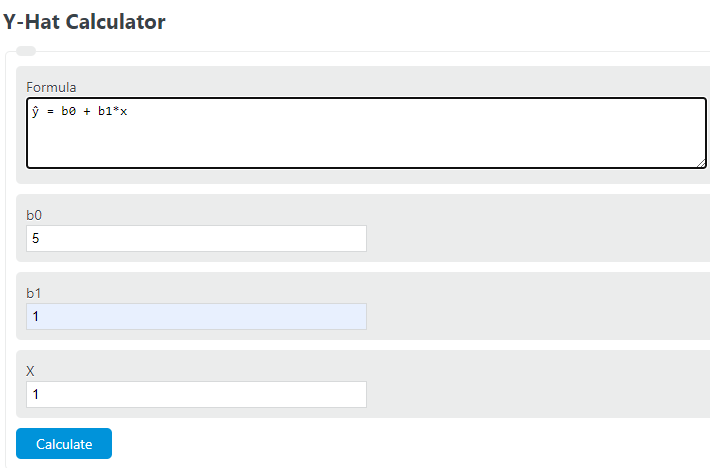
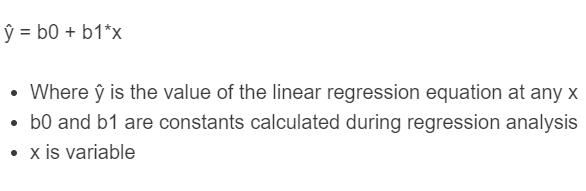
Equation mode uses the regression line directly:
Paired data mode fits the least-squares line first, then predicts:
Summary stats mode uses the correlation form:
- ŷ: predicted value of the response variable
- b₀: y-intercept of the regression line
- b₁: slope of the regression line
- x: predictor value you want to plug in
- x̄, ȳ: means of the X and Y samples
- sₓ, sᵧ: sample standard deviations of X and Y
- r: Pearson correlation coefficient between X and Y
The three forms give the same ŷ when the inputs are consistent. Use ŷ only for x values inside or near the range of the original data. Predicting far outside that range is extrapolation and is not reliable. The model also assumes a roughly linear relationship and independent observations.
The Equation tab is the fastest option when a textbook or software output already gives you b₀ and b₁. The Paired Data tab does the regression fit for you from raw X and Y lists and also returns r, R², and the residual standard error. The Summary Stats tab is useful when a problem provides means, standard deviations, and r instead of raw data.
Reference Tables
Use the table below to interpret R² values reported alongside ŷ. R² tells you how much of the variation in Y is explained by the regression line.
| R² value | Fit quality | What it means for ŷ |
|---|---|---|
| 0.00 – 0.20 | Very weak | Predictions are barely better than using ȳ. |
| 0.20 – 0.50 | Weak to moderate | ŷ captures a real trend but with wide error bands. |
| 0.50 – 0.80 | Moderate to strong | ŷ is generally useful for prediction. |
| 0.80 – 1.00 | Strong | ŷ tracks the data closely; residuals are small. |
The next table shows how the slope sign and the predictor value combine to move ŷ relative to ȳ.
| Slope b₁ | x compared to x̄ | ŷ compared to ȳ |
|---|---|---|
| Positive | x > x̄ | ŷ > ȳ |
| Positive | x < x̄ | ŷ < ȳ |
| Negative | x > x̄ | ŷ < ȳ |
| Negative | x < x̄ | ŷ > ȳ |
| Any | x = x̄ | ŷ = ȳ |
Worked Example and FAQ
Example. A study fits the equation ŷ = 30.36 + 1.72x to predict test score from study hours. To predict the score for a student who studies 12 hours:
- b₀ = 30.36, b₁ = 1.72, x = 12
- ŷ = 30.36 + 1.72(12) = 30.36 + 20.64 = 51.00
If you instead had r = 0.85, x̄ = 8, sₓ = 3, ȳ = 44, sᵧ = 6.07, the summary form gives b₁ = 0.85(6.07/3) ≈ 1.72 and the same ŷ at x = 12.
What does the hat in ŷ mean? The hat marks ŷ as an estimate produced by the model, not an observed data point. Observed values are written as y.
Is ŷ the same as the mean of Y? No. ŷ depends on x. It only equals ȳ when x = x̄ or when the slope is zero.
Why does my ŷ differ slightly from a textbook answer? Rounding b₀ and b₁ before plugging in x introduces small errors. The Paired Data tab avoids this by keeping full precision through the calculation.
Can I use this for multiple regression? No. This calculator handles one predictor. For two or more predictors you need the form ŷ = b₀ + b₁x₁ + b₂x₂ + … and a multiple regression tool.
What if my X values have no variation? Σ(x – x̄)² will be zero and the slope is undefined. You need x values that differ from each other to fit a line.