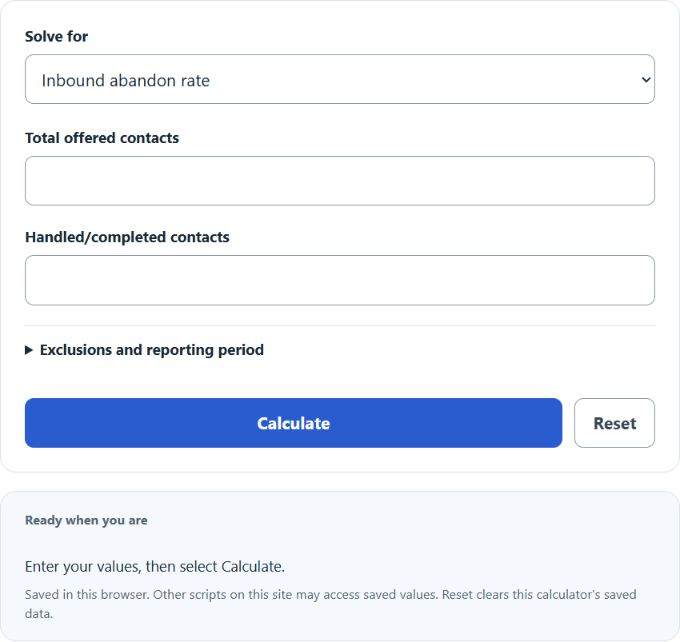
Calculate call abandonment rate from offered and handled calls, or cart abandonment rate from carts and purchases, plus outbound rates and target limits.
Related Calculators
- Service Level Calculator
- AOV (Average Order Value) Calculator
- Expected Revenue Calculator
- Unit Sales Calculator
- All Business Calculators
Abandon Rate Formula
The calculator uses one of four formulas depending on the mode you select.
Inbound rate mode:
Cart abandonment mode: Cart Abandonment Rate = (Carts Created − Completed Purchases) / Carts Created × 100
Outbound live-answer mode:
Target Rate mode:
- Calls Offered — total inbound calls that reached the queue.
- Calls Abandoned — callers who hung up before being answered.
- Live Answers — outbound calls answered by a person.
- Handled — eligible contacts completed or answered; counts must use the same reporting period.
- Target Rate — the abandon percentage you do not want to exceed.
- Total Events — calls, sessions, or forms expected in the period.
Enter offered and handled contacts before exclusions, then enter excluded short contacts that were not handled in the optional exclusions field. The calculator removes these from the eligible denominator. Do not subtract the same exclusion twice.
Illustrative Abandon Rate Bands
The first table illustrates possible planning bands, not universal benchmarks. Compare each channel using consistent reporting definitions and your own documented goal.
| Call Center Rate | Interpretation |
|---|---|
| Under 3% | Illustrative lower-rate band; compare with your goal. |
| 3% – 5% | Illustrative planning band; not a universal industry standard. |
| 5% – 8% | Illustrative higher-rate band; investigate with additional data. |
| Over 8% | Rate alone does not diagnose staffing or routing. |
| Channel | Comparison basis |
|---|---|
| E-commerce cart (desktop) | Compare with consistently defined site data |
| E-commerce cart (mobile) | Compare with consistently defined site data |
| Lead / contact form | Compare with consistently defined site data |
| Live chat | Compare with consistently defined channel data |
Worked Example
A support line received 1,200 calls yesterday. 84 callers hung up before an agent picked up.
- Divide abandoned by offered: 84 ÷ 1,200 = 0.07
- Multiply by 100: 0.07 × 100 = 7.00%
For this example, enter 1,200 offered contacts, 1,116 handled contacts and no exclusions. If the team sets a 5% target on the same volume, the whole-contact ceiling is 60 abandons, so the gap from 84 is 24 contacts.
FAQ
Should I count short abandons? Use your organization’s documented exclusion rule; there is no universal short-contact threshold. Apply it consistently and count an exclusion only once.
Why is my cart abandon rate so high? Rates depend on the site and event definitions. Inbound mode can model started and completed sessions when every eligible session is either completed or abandoned. Use consistently defined counts; rate alone does not identify the cause.
Is abandon rate the same as bounce rate? No. Bounce rate measures visitors who leave without interacting. Abandon rate measures users who started a process and quit before finishing it.