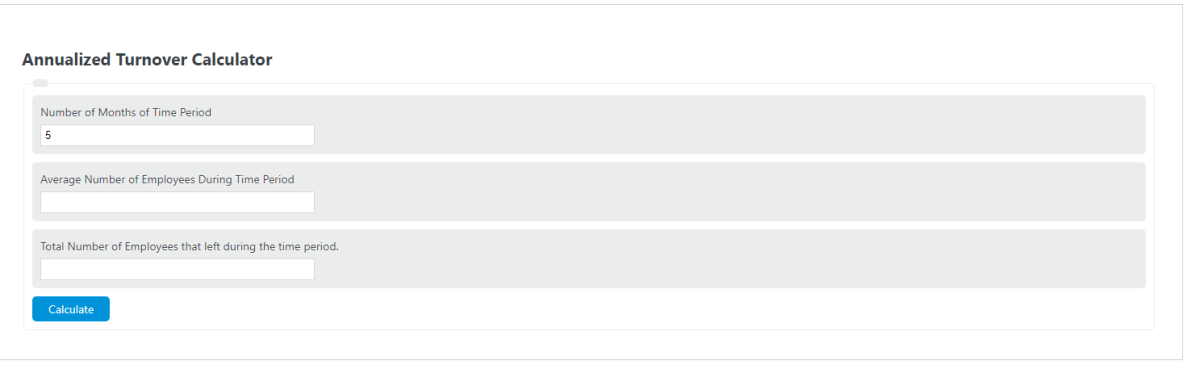
Calculate annualized employee turnover rate, period turnover, average headcount, and annual separations from departures over any measurement period.
Related Calculators
- Sales Growth Calculator
- Annual Profit Calculator
- Cost Volume Profit Calculator
- Price Increase Calculator
- All Business Calculators
Annualized Turnover Formula
The following formula is used to calculate an annualized turnover rate.
Formula source: BLS Handbook of Methods: Job Openings and Labor Turnover Survey (2023)
- Where ATR is the annualized turnover rate (%)
- L is the number of employees who left during the time period (separations)
- E is the average number of employees during the time period
- M is the total number of months in the period
The factor of 12/M scales any sub-annual measurement window up to a full 12-month equivalent. When M equals 12 (a full year of data), the formula simplifies to (L / E) * 100, which is the standard annual turnover rate. This scaling is what distinguishes an annualized rate from a simple period rate and allows HR teams to compare turnover across measurement windows of different lengths on equal footing.
Average headcount (E) is typically calculated by adding the headcount at the beginning of the period to the headcount at the end of the period and dividing by two. For greater accuracy over longer periods, many organizations sum monthly headcounts and divide by the number of months. The BLS JOLTS program uses this latter approach, summing 12 monthly Current Employment Statistics (CES) employment levels as the denominator for its annual rate calculations.
What Is Annualized Turnover?
Annualized turnover is a workforce metric that expresses the rate at which employees leave an organization over a standardized 12-month period. It converts separation data collected over any time window (a single month, a quarter, six months) into a projected annual percentage, making it possible to compare workforce stability across departments, business units, or time periods regardless of how long each was measured.
The metric counts all separations: voluntary resignations, involuntary terminations, retirements, end-of-contract departures, and transfers out of a business unit. It does not distinguish between the reasons an employee left. That is why organizations often track annualized turnover alongside more specific metrics like the voluntary turnover rate or the regrettable turnover rate to get a complete picture of workforce health.
A company with 500 average employees that lost 25 people during a single quarter (3 months) would have an annualized turnover rate of (25 / 500) * (12 / 3) * 100 = 20%. This does not mean the company will necessarily lose 100 employees over the full year. It means the rate at which people left during that quarter, if sustained for 12 months, would produce turnover equivalent to 20% of the workforce.
Types of Employee Turnover
Not all turnover carries the same organizational impact. HR professionals classify turnover along two independent axes, and understanding the intersection of these categories is critical to interpreting what an annualized rate actually signals about business health.
Voluntary turnover occurs when the employee initiates the departure. Common drivers include better compensation elsewhere, limited advancement opportunities, poor manager relationships, burnout, and relocation. According to Mercer’s 2025 Workforce Turnover Survey, the average U.S. voluntary turnover rate has fallen to 13.5%, down from 17.3% in 2023 and 24.7% in 2022, reflecting a labor market that has cooled from the post-pandemic reshuffling period.
Involuntary turnover is employer-initiated and includes performance-based terminations, layoffs driven by restructuring or economic conditions, and end-of-contract separations. This category also captures dismissals for policy violations and reductions in force (RIFs).
Functional turnover describes departures that benefit the organization. When a consistently low-performing employee resigns on their own, it saves the company the time, documentation, and legal exposure involved in a formal termination process. Functional turnover is not a problem to solve; it is a natural, healthy component of workforce renewal.
Dysfunctional turnover occurs when high-performing or hard-to-replace employees leave. This is the costliest form of turnover because it removes institutional knowledge, disrupts team productivity, and triggers expensive replacement cycles. Identifying dysfunctional turnover within the annualized rate is what separates useful workforce analysis from simple headcount accounting.
Turnover Rate Benchmarks by Industry
The BLS Job Openings and Labor Turnover Survey (JOLTS) reported an average total separations rate of 3.3% per month for 2024, down from 3.6% in 2023. Annualized, the 2024 figure translates to roughly 39.6% total turnover across the U.S. economy when all separations (quits, layoffs, discharges, retirements, and other) are included.
The overall employer turnover rate in 2024 was 18% according to industry surveys, down sharply from 26% in 2022 and 2023. However, rates vary enormously by sector. Retail and wholesale trade consistently report the highest annualized turnover, reaching approximately 24.9% on voluntary departures alone. Accommodation and food services follows closely, driven by seasonal hiring patterns and the prevalence of part-time and entry-level roles. At the other end of the spectrum, chemicals (9.1%), insurance and reinsurance (8.2%), and government (with monthly separation rates around 1.4%) show the most stable workforces.
Turnover also varies by job level. Executive and senior leadership roles average around 5.2% annualized voluntary turnover, while para-professional and blue-collar positions average 12.5%. This gap exists partly because senior employees tend to have higher compensation, longer tenure, and more organizational investment in their retention, while entry-level roles face lower switching costs and more competitive labor market dynamics.
The Financial Cost of Employee Turnover
Replacing a departing employee costs between 50% and 200% of their annual salary, according to research from Gallup and SHRM. The range depends heavily on role complexity, seniority, and specialization. For frontline employees, the replacement cost averages around 40% of annual salary. Technical and mid-level roles average approximately 80%. Leadership and executive positions can reach 200% or more, with some estimates for C-suite replacements exceeding 213% of annual compensation.
These costs break down into hard and soft components. Hard costs (roughly 30% to 40% of total replacement cost) include job advertising, recruiter fees, background checks, onboarding administration, and training materials. Soft costs (the remaining 60% to 70%) cover lost productivity during the vacancy period, reduced output while the new hire ramps up, the impact on team morale and workload redistribution, and the potential loss of client relationships or institutional knowledge.
To put this in concrete terms, a 100-person company paying an average salary of $50,000 with a 20% annualized turnover rate would lose approximately 20 employees per year. At a conservative replacement cost of 75% of salary ($37,500 per departure), the annual cost of turnover reaches $750,000. That figure does not account for the downstream effects on remaining employees, who experience increased workloads and may themselves become flight risks, creating a compounding turnover cycle.
Annualized Turnover vs. Period Turnover Rate
A period turnover rate measures separations over whatever window was observed without any scaling. If 10 people left a 200-person company in one quarter, the period turnover rate for that quarter is simply (10 / 200) * 100 = 5%. The annualized turnover rate takes that same data and projects it across 12 months: (10 / 200) * (12 / 3) * 100 = 20%.
Neither metric is inherently better. Period rates are useful for tracking month-over-month or quarter-over-quarter trends within a single organization. Annualized rates are necessary for benchmarking against published industry data (which is almost always expressed as an annual figure) and for financial planning, since budgets and workforce plans typically operate on annual cycles.
One important caveat: annualizing a very short measurement period (such as a single month) can produce misleading results because it assumes the observed rate will persist uniformly. Seasonal businesses, companies undergoing restructuring, or organizations that conduct annual layoffs in a specific quarter will see their annualized rate fluctuate dramatically depending on which month is measured. For more reliable annualized figures, use at least a full quarter of data, and ideally six months or more.
How the BLS Calculates Turnover
The Bureau of Labor Statistics publishes official turnover data through its Job Openings and Labor Turnover Survey (JOLTS), which samples approximately 21,000 nonfarm business and government establishments each month. The JOLTS program breaks total separations into three categories: quits (voluntary), layoffs and discharges (involuntary), and other separations (retirements, deaths, transfers to other locations within the same company, and separations due to disability).
For annual rates, the BLS sums the 12 monthly separation levels and divides by the sum of the 12 monthly employment levels from the Current Employment Statistics (CES) survey, then multiplies by 100. Both numerator and denominator are rounded to the nearest thousand before division. This approach produces a weighted average that gives more influence to months with higher employment, reflecting the actual proportion of the workforce that separated over the year. The 2024 annual averages were 2.1% for quits, 1.1% for layoffs and discharges, and 0.2% for other separations, totaling 3.4% in monthly rate terms.
Strategies for Reducing Annualized Turnover
Research suggests that approximately 75% of voluntary turnover is preventable, meaning organizations have significant control over their annualized rate through targeted retention strategies. The most effective interventions address the root causes that show up repeatedly in exit interview data and engagement surveys.
Compensation alignment is the most direct lever. Employees who believe they are paid below market are significantly more likely to leave within 12 months. Regular market benchmarking using salary survey data (not just internal equity reviews) helps identify roles where pay gaps have widened. However, compensation alone is rarely sufficient. Gallup’s research consistently shows that manager quality is the single strongest predictor of voluntary turnover, with employees who rate their manager poorly being four times more likely to be actively job searching.
Career development pathways reduce turnover among high performers specifically. When top talent cannot see a clear trajectory for growth, they begin looking externally. Structured promotion timelines, skill-building budgets, mentorship programs, and internal mobility platforms all signal that the organization invests in long-term employee development rather than treating roles as static positions.
Onboarding quality affects early-tenure turnover disproportionately. Employees who leave within their first year represent one of the most expensive forms of turnover because the organization incurs full replacement cost with minimal return on investment. Structured 90-day onboarding programs that include role-specific training, social integration with the team, and regular check-ins with a direct manager reduce first-year voluntary departures measurably.