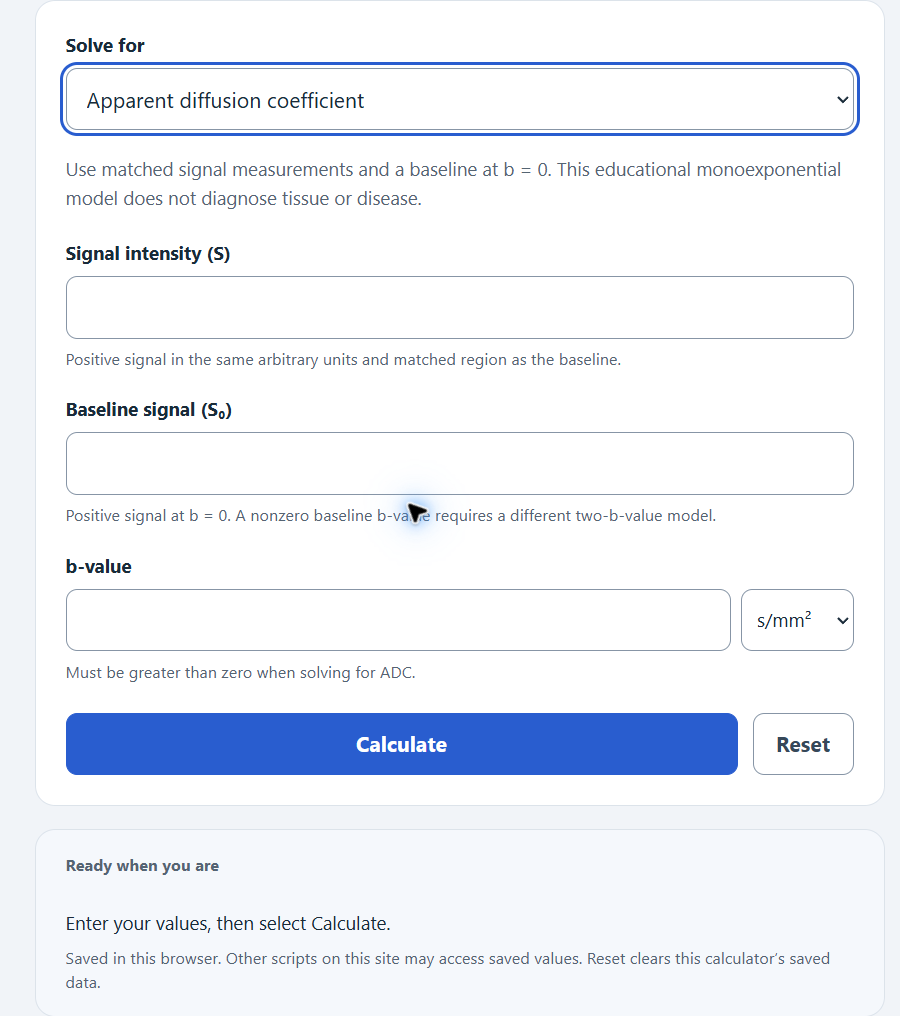
Calculate apparent diffusion coefficient, b-value, signal intensity, or baseline signal from the other three using the MRI diffusion equation.
Related Calculators
- Resistive Index Calculator
- Rmi (Risk Of Malignancy Index) Calculator
- Bladder Volume Calculator
- Amniotic Fluid Index Calculator
- All Health and Medical Calculators
Apparent Diffusion Coefficient Formula
The apparent diffusion coefficient calculation is based on the monoexponential diffusion-weighted MRI signal model:
Rearranged forms used to solve for each missing value are:
- S = signal intensity measured at the selected b-value
- S0 = baseline signal intensity measured at b = 0; a nonzero baseline requires using the difference between two b-values
- b = diffusion weighting factor, commonly entered in s/mm²
- ADC = apparent diffusion coefficient, commonly expressed in mm²/s
- ln = natural logarithm
- e = Euler’s number, used in exponential decay calculations
Select the unknown value under Solve for, then enter the other three values. If ADC is missing, it uses the ratio between the measured signal and baseline signal. If signal intensity is missing, it applies exponential decay from the baseline signal. If the b-value is missing, it solves for the amount of diffusion weighting needed to produce the observed signal drop. If baseline signal is missing, it reverses the decay equation to estimate S0.
ADC and b-Value Model Interpretation
ADC depends on acquisition settings, tissue and region of interest. This educational model supplies no diagnostic thresholds. The tables describe mathematical behavior only; clinical interpretation requires appropriate imaging expertise.
| Model quantity | Numerical threshold | Model meaning |
|---|---|---|
| Lower ADC | No universal threshold | Slower modeled signal decay at a fixed positive b-value |
| ADC comparison | No universal threshold | Compare matched acquisition protocols; no normal-tissue classification is supplied |
| Higher ADC | No universal threshold | Faster modeled signal decay at a fixed positive b-value |
| b-value condition | Model condition | Effect on signal |
|---|---|---|
| b = 0 | Baseline measurement | Signal equals S0 |
| b > 0 | Positive ADC | Signal is less than baseline |
| Increasing b at fixed ADC > 0 | Stronger modeled diffusion weighting | Signal decreases exponentially; noise and model limitations are not simulated |
Example Calculations
Example 1: Calculate ADC
Suppose the signal intensity is 450, the baseline signal intensity is 1000, and the b-value is 800 s/mm².
The apparent diffusion coefficient is approximately 0.0010 mm²/s.
Example 2: Calculate Signal Intensity
Suppose the baseline signal intensity is 1200, the b-value is 1000 s/mm², and the ADC is 0.0009 mm²/s.
The estimated signal intensity is approximately 487.9.
FAQ
What units should I use for ADC and b-value?
ADC is commonly entered in mm²/s, and b-value is commonly entered in s/mm². These units pair naturally because multiplying b by ADC gives a unitless exponent. The calculator converts the selected units: 1 cm²/s = 100 mm²/s and 1 s/cm² = 0.01 s/mm². Results include both unit conventions.
Why does signal intensity decrease as the b-value increases?
A higher b-value applies stronger diffusion weighting. In the formula, the term e-b × ADC becomes smaller as b increases, so the measured signal intensity decreases relative to the baseline signal intensity.
Can ADC be negative?
This nonnegative diffusion model rejects signal greater than baseline instead of reporting a negative ADC. Such measurements may reflect noise or inconsistent acquisition and require review; the calculator does not identify a clinical cause.