Calculate expected frequencies for a single cell or contingency table and find chi-square, degrees of freedom, and p-value from observed counts.
Expected Frequency Formula
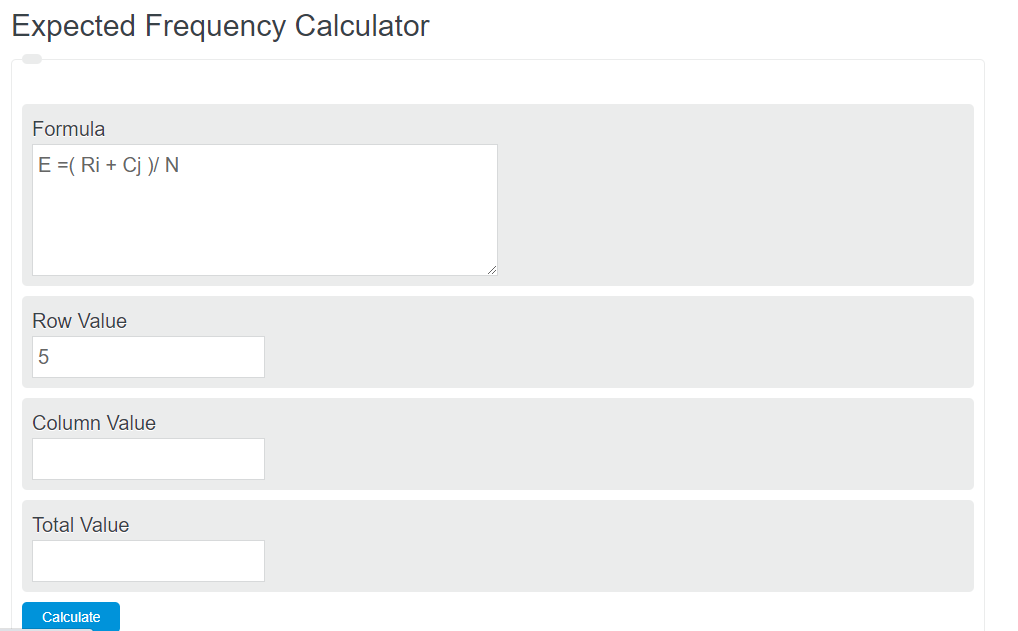
The following equation can be used to calculate the expected frequency of a contingency table.
- Where E is the expected frequency (expected count) for cell (i, j)
- Ri is the total in the i-th row
- Cj is the total in the j-th column
- N is the grand total
To calculate the expected frequency, multiply the total of the i-th row by the total of the j-th column, then divide the result by the grand total.
In a contingency table, this expected frequency calculation must be performed once per cell. For an r × c table, you will do the calculation r × c times (for example, a 32 × 32 table has 1024 cells).
Expected Frequency Definition
Expected frequency (or expected count) is the average number of times an outcome would occur over many repetitions, often computed under a null hypothesis. For example, the probability of drawing any specific card from a standard 52-card deck in one draw is 1/52 ≈ 0.01923 ≈ 1.923%. If you make n draws with replacement, the expected number of times that specific card appears is n/52.
Expected frequencies are most often used when analyzing contingency tables. You can see an example of this below.
FAQ
An expected frequency (expected count) is the number of observations you would expect in a category or contingency-table cell under a stated model (often a null hypothesis).
For a contingency-table cell (i, j), expected frequency is calculated as E = (row total × column total) / grand total, and you repeat this for each cell.