Calculate road gradeability by converting slope angle to percent grade or estimating GVWR grade from test-track angle and vehicle weight.
Related Calculators
- Tractive Force Calculator
- Torque to Weight Ratio Calculator
- Hp To Kg Ratio Calculator
- Drivetrain Loss Calculator
- All Automotive Calculators
How the Gradeability Calculator Works
Gradeability measures how steep a slope a vehicle can climb and is usually expressed as percent grade, not degrees. A 20% grade means the surface rises 20 units vertically for every 100 units of horizontal travel. This calculator estimates gradeability at the vehicle’s maximum recommended GVWR by scaling a known hill-climb test performed at a different vehicle weight.
This is especially useful when you know the test-track angle and the vehicle weight during the test, but you want to estimate how the same vehicle would perform when loaded closer to its rated maximum operating weight. The result is best treated as a simplified engineering estimate for comparison, planning, and quick analysis.
Gradeability Formula
- GRB = estimated gradeability as a percent grade
- a = slope angle of the test track
- Wv = actual vehicle weight during the test
- WGVWR = maximum recommended GVWR used for the estimate
If your angle is entered in degrees, it must be converted to radians before the trigonometric functions are evaluated.
Percent grade and slope angle are related, but they are not the same unit.
Because the formula uses a weight ratio, the vehicle weight and GVWR can be entered in pounds or kilograms as long as both use the same unit.
What the Result Means
A higher result means the vehicle can theoretically handle a steeper climb at GVWR under this simplified model. If the estimated gradeability is 35%, the vehicle is being estimated for a slope that rises about 35 units for every 100 units of horizontal distance.
Do not confuse percent grade with degrees. Even a small angle can represent a surprisingly large percent grade, which is why roadway slopes and vehicle test data can look very different when expressed in different units.
Angle to Percent Grade Reference
| Slope Angle | Equivalent Percent Grade | Rise per 100 Horizontal Units |
|---|---|---|
| 5° | 8.75% | 8.75 |
| 10° | 17.63% | 17.63 |
| 15° | 26.79% | 26.79 |
| 20° | 36.40% | 36.40 |
| 25° | 46.63% | 46.63 |
| 30° | 57.74% | 57.74 |
How to Use the Calculator
- Enter the slope angle from the vehicle test track.
- Select the correct angle mode so the value is interpreted as degrees or radians properly.
- Enter the vehicle weight during the test.
- Enter the vehicle’s maximum recommended GVWR.
- Calculate the estimated gradeability and interpret the answer as a percent grade.
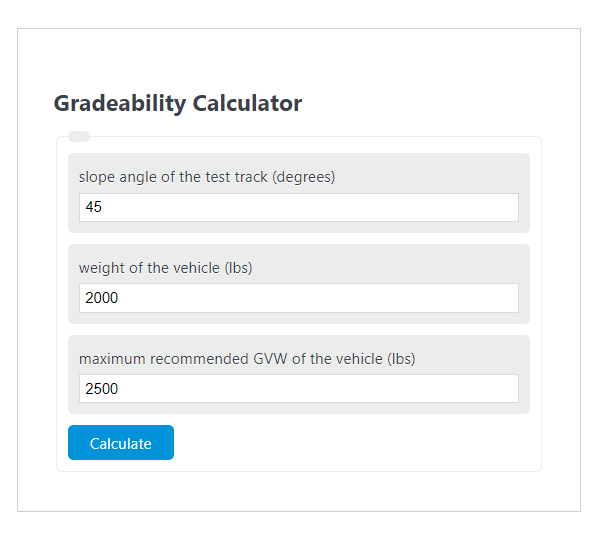
Example
Suppose a vehicle completes a test on a 30° slope while weighing 2,000 lb, and you want to estimate gradeability at a GVWR of 2,500 lb.
The estimated gradeability is 43.64%. That means the simplified model predicts the vehicle could handle a slope that rises about 43.64 units for every 100 horizontal units when loaded to the stated GVWR.
How Each Input Affects the Estimate
- Higher test-track angle: increases the estimated gradeability.
- Higher vehicle test weight: increases the estimate because more climbing ability was demonstrated under load.
- Higher GVWR: lowers the estimate if the test angle and test weight stay the same.
- Consistent units: is essential for the two weight inputs, even though either lb or kg can be used.
Important Assumptions
This calculator uses a simplified tractive-force scaling approach. It focuses on slope-related loading and does not explicitly model every real-world factor that affects climbing performance.
- Rolling resistance is not directly added.
- Aerodynamic drag is neglected.
- Surface traction limits are not included.
- Drivetrain losses, tire deformation, and wheel slip are not independently modeled.
- Engine or motor power, torque curve, gearing, and cooling limits may affect real hill-climb performance.
Because of these assumptions, the estimate is most useful for quick comparisons, early design checks, and interpreting test results rather than replacing full vehicle validation.
Input Validity Check
For the equation to return a real result, the quantity inside the inverse sine must stay within the allowable trigonometric range.
If the calculator returns an invalid result, double-check the angle mode, the entered slope angle, and whether both weight values use the same measurement system.
Common Mistakes
- Confusing degrees with percent grade.
- Mixing pounds and kilograms between the vehicle weight and GVWR fields.
- Using curb weight instead of the actual test weight including payload, fuel, passengers, or cargo.
- Assuming the estimate guarantees real-world performance on loose, wet, icy, or uneven surfaces.
- Forgetting that uphill climbing ability and downhill braking performance are different topics.
Frequently Asked Questions
Is a 30% grade the same as a 30° slope?
A 30% grade is much less steep than a 30° slope. A 30° angle corresponds to about 57.74% grade.
Can I use kilograms instead of pounds?
Yes. The vehicle weight and GVWR can be entered in kilograms or pounds as long as both use the same unit.
Why does gradeability decrease as GVWR increases?
The same available climbing capability has to move more total weight, so the estimated climb the vehicle can sustain becomes less steep.
When is this calculator most useful?
It is helpful when comparing vehicles, interpreting hill-climb test data, estimating loaded performance from a lighter test condition, or doing a quick feasibility check before more detailed analysis.