Calculate labor productivity, units per labor hour, staffing and takt time, revenue per employee, and labor efficiency ratios.
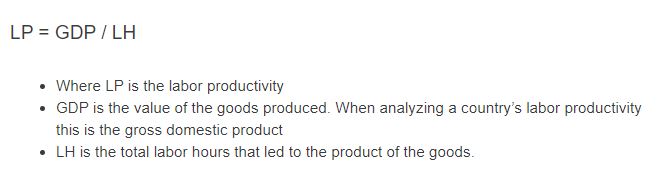
Labor Productivity Formula
- LP = labor productivity ($ per hour, or units per hour)
- O = total output (dollar value of goods or services produced, or unit count)
- LH = total labor hours consumed in producing that output
At the national level, O is GDP measured in constant-dollar PPP terms, and LH is total hours worked by all employed persons including employees, self-employed, and proprietors. The OECD and BLS use this definition for cross-country comparisons. The BLS constructs output as a Fisher-Ideal index of real value-added, excluding general government, nonprofit institutions, private household employees, and imputed rent on owner-occupied housing.
| Metric | Formula | Best Used For |
|---|---|---|
| Labor Productivity | Output / Labor Hours | Hourly output rate; national GDP comparisons |
| Revenue per Employee (RPE) | Revenue / FTE Count | Business benchmarking; workforce sizing |
| Units per Labor Hour | Units Produced / Labor Hours | Manufacturing; line balancing |
| Labor Efficiency Ratio (LER) | Gross Profit / Labor Cost | Service businesses; target typically above 3.0x |
| Takt Time | Available Seconds / Unit Demand | Lean manufacturing; operator count planning |
Global Labor Productivity Benchmarks (2023)
OECD data for 2023 measures GDP per hour worked in USD adjusted for purchasing power parity (PPP). The OECD-wide average was approximately $70 per hour. High-performing economies sit nearly twice the average; the lowest-ranked OECD members are around one-third of it.
| Country / Region | GDP/Hour Worked (USD PPP) | vs. OECD Average |
|---|---|---|
| Ireland | ~$140+ | 2x+ |
| Norway | ~$140+ | 2x+ |
| United States | ~$80 | ~115% |
| OECD Average | $70 | 100% |
| Mexico | ~$23 | ~33% |
| Colombia | ~$23 | ~33% |
Note: Ireland's figure is inflated by multinational IP income booked domestically. Its modified GNI (GNI*) per hour is materially lower and considered a more accurate measure of domestic productive capacity.
US Nonfarm Business Productivity Growth
| Year | Output per Hour Growth (BLS) |
|---|---|
| 2022 | -1.5% |
| 2023 | +1.6% |
| 2024 | +2.3% |
The 2022 decline reflected post-pandemic labor re-hiring outpacing output recovery. The 2023 and 2024 rebounds were driven by services sector output growth, particularly data processing, online retail, and professional services. The euro area posted -0.9% in 2023, its largest decline since 2009, highlighting the divergence from US trends.
Revenue per Employee Benchmarks (US, 2024)
| Percentile | Revenue per Employee |
|---|---|
| 75th Percentile (top performers) | $564,706 |
| Median (50th Percentile) | $310,000 |
| 25th Percentile | $176,471 |
Software sector RPE averaged $290,000 in 2024, up 27% from $228,000 in 2023, driven by sustained revenue growth alongside headcount reductions. Retail trade sector labor productivity rose 4.6% in 2024 as output held steady while hours worked declined. Wholesale trade rose 1.8%.
Three Drivers of Labor Productivity Growth
Physical capital gives workers better tools: machinery, software, automation. New technology reduces cycle time for the same output without proportional input cost increases. Human capital, built through training and education, raises quality and output per hour. Historical research shows technology is the most durable driver; capital accumulation alone faces diminishing marginal returns as the capital-to-labor ratio rises. Economies that have maintained long-run productivity growth have done so primarily through technology adoption rather than capital deepening alone.
Labor Productivity vs. Multifactor Productivity
Labor productivity (output / labor hours) is a partial-factor measure. It credits all output gains to labor even when capital investment or technology is the actual cause. Multifactor productivity (MFP), also called total factor productivity (TFP), divides output by a weighted index of all inputs: labor weighted approximately 0.7 and capital approximately 0.3. Rising labor productivity with flat MFP signals that workers are benefiting from more capital per person, not greater inherent efficiency. Rising MFP indicates genuine efficiency gains across all inputs simultaneously. For this reason, policymakers and economists use MFP as the more complete measure of productive capacity growth.