Calculate lactate threshold from maximum heart rate and LT percentage, estimate HRmax from age, and find target heart rate with Karvonen.
Related Calculators
- Stride Length Calculator
- Hours To Steps Calculator
- Elliptical Interval Calorie Calculator
- Swim Distance Calculator
- All Sports and Fitness Calculators
Lactate Threshold Formula
The following formula is used to estimate the heart rate at lactate threshold (LT) using heart rate data:
Variables:
- LT is the heart rate at lactate threshold (typically in bpm)
- HRmax is the maximum heart rate
- LTpercentage is the percentage of HRmax at the lactate threshold
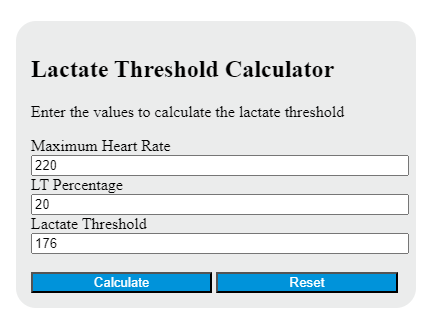
To calculate the lactate-threshold heart rate, multiply the maximum heart rate by the percentage of HRmax at the lactate threshold (expressed as a decimal).
What is a Lactate Threshold?
The lactate threshold refers to the exercise intensity at which blood lactate concentration begins to rise more rapidly than at lower intensities. This threshold is significant because it is associated with the highest intensity that can typically be sustained for a prolonged period. Lactate itself is a normal product of glycolysis and can be shuttled and used as fuel; the decrease in pH (“acidosis”) that can contribute to fatigue is more closely related to increased hydrogen ion (H+) production during high-rate metabolism, with lactate often serving as a correlated marker rather than the direct cause. The lactate threshold is, therefore, a critical factor in endurance sports, where sustaining a high intensity of exercise for a prolonged period is key to performance.
How to Calculate Lactate Threshold?
The following steps outline how to calculate the Lactate Threshold:
- First, determine the lactate levels (mmol/L) at different exercise intensities.
- Next, plot a graph with exercise intensity on the x-axis and lactate levels on the y-axis.
- Identify the point on the graph where lactate levels start to increase exponentially.
- This point is known as the Lactate Threshold.
- Finally, record the exercise intensity at the Lactate Threshold.
Example Problem:
Use the following variables as an example problem to test your knowledge.
Lactate levels (mmol/L) at different exercise intensities:
Intensity 1: 2.5 mmol/L
Intensity 2: 3.2 mmol/L
Intensity 3: 4.1 mmol/L
Intensity 4: 5.5 mmol/L
Intensity 5: 7.8 mmol/L
Plot a graph with exercise intensity on the x-axis and lactate levels on the y-axis. Identify the point on the graph where lactate levels start to increase exponentially. Record the exercise intensity at the Lactate Threshold.