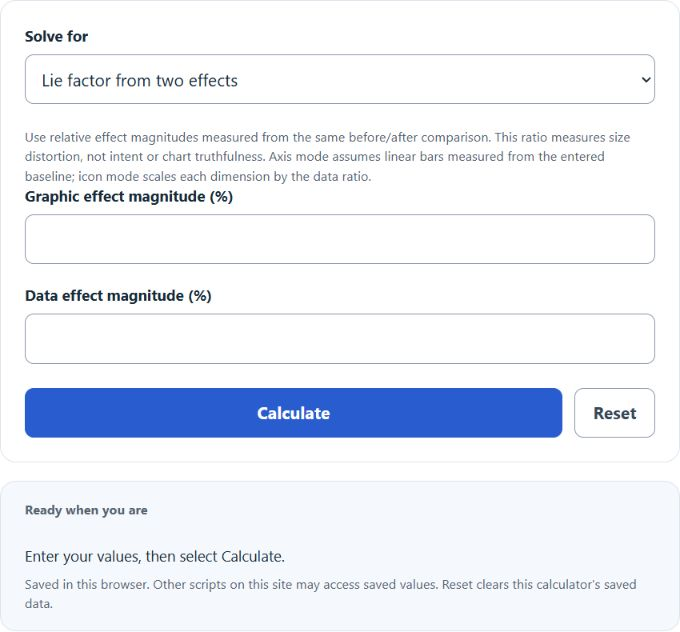
Calculate a chart’s lie factor from graphic and data effects, audit a truncated-axis bar chart, or test area and volume icon distortion with worked steps.
- All Statistics Calculators
- Scale Factor Dilation Calculator
- Scale Calculator
- Combined Scale Factor Calculator
Lie Factor Formula
The lie factor compares the relative change shown in a graphic with the relative change in its data. Use magnitudes measured over the same comparison; a zero data change leaves the factor undefined.
Variables:
- LF is the Lie Factor
- SG is the magnitude of relative change shown in the graphic, as a percentage
- SD is the magnitude of relative change in the data, as a nonzero percentage
Divide graphic-effect magnitude by data-effect magnitude. A result of 1 is proportionate in magnitude; above 1 exaggerates and below 1 understates that change. This does not establish intent or overall chart accuracy. For the concept, see Edward Tufte’s discussion.
How to Calculate Lie Factor?
The following steps outline how to calculate the Lie Factor.
- First, determine the size of the effect shown in the graphic.
- Next, determine the size of the effect shown in the data.
- Next, gather the formula from above = LF = SG / SD.
- Finally, calculate the Lie Factor.
- After inserting the variables and calculating the result, check your answer with the calculator above.
Example Problem :
Use the following variables as an example problem to test your knowledge.
graphic effect = 15%
data effect = 10%
LF = 15% / 10% = 1.5. The graphic shows 1.5 times the relative change in the data. Axis mode assumes linear bar lengths above the shown baseline. Icon mode assumes every linear dimension is scaled by the data ratio; area or volume then changes by its square or cube.