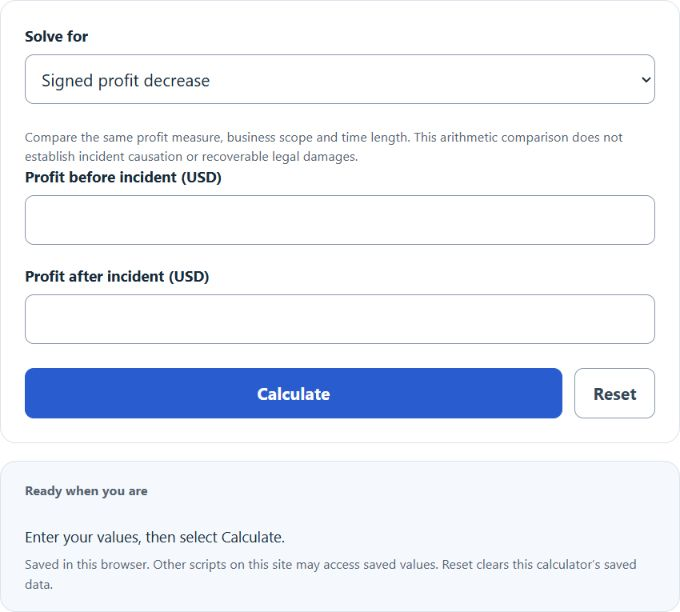
Compare profits before and after an incident, or solve a missing amount from their signed difference.
How to Calculate Lost Profits
The calculator compares before-period and after-period profit over the same time window and comparable operating conditions. Their signed difference alone does not establish that the incident caused the change or determine legally recoverable damages.
| Input | Meaning | How to Enter It |
|---|---|---|
| Profits Before Incident (PB) | Profit earned during a normal comparison period before the damaging event | Use profit, not revenue, for the same number of days, weeks, or months you plan to compare |
| Profits After Incident (PA) | Profit earned during the matching period after the event | Use the same accounting method, business unit, and time length as PB |
| Lost Profits (LP) | Signed difference between before-period and after-period profit | The calculator returns this automatically |
How to Use the Calculator Correctly
- Choose a comparison period, such as 7 days, 30 days, or 1 quarter.
- Enter profit from a normal period before the incident.
- Enter profit from the matching period after the incident.
- Review the result and confirm that both periods are truly comparable.
| Check | Why It Matters |
|---|---|
| Same time length | A 10-day post-incident period should be compared to a 10-day baseline, not to a month or quarter |
| Same season or demand level | Busy-season profits and slow-season profits are usually not directly comparable |
| Same accounting basis | Mixing gross profit, net profit, cash flow, or revenue will distort the result |
| Same business scope | Compare the same location, product line, or operating segment where possible |
Reading the Result
| Result | Interpretation |
|---|---|
| Positive value | Profit was lower in the after period; incident causation requires separate analysis |
| Zero | No measurable profit change between the two periods |
| Negative value | Profit after the incident exceeded the baseline, so there is no loss under this comparison |
Example Scenarios
| Before Incident | After Incident | Lost Profits | Meaning |
|---|---|---|---|
| $18,000 | $11,500 | $6,500 | The business earned $6,500 less profit during the comparison period |
| $42,000 | $42,000 | $0 | No profit loss appears for that period |
| $25,000 | $27,500 | -$2,500 | Post-incident profit was higher than the baseline |
Common Mistakes
| Mistake | Why It Causes Problems | Better Approach |
|---|---|---|
| Using revenue instead of profit | Revenue ignores costs and can overstate the loss | Use the same profit measure for both periods |
| Comparing different time spans | A longer baseline usually inflates the apparent loss | Match the exact period length |
| Ignoring seasonality | Normal fluctuations may be mistaken for damages | Use a comparable historical period |
| Changing the expense treatment | Different profit definitions make the comparison unreliable | Keep the accounting method consistent |
When This Method Works Best
This calculator is most useful when you have a clear pre-incident baseline and a matching post-incident period. It is especially practical for short-term interruptions, sudden performance drops, and situations where the business had relatively stable operations before the event. The page’s method is specifically the before-and-after approach.
Important Context
Lost profits typically refer to profit that a person or business would have earned but for a damaging event. In legal or claims settings, recovery often depends on the facts, causation, reasonable support for the calculation, mitigation efforts, and the rules of the applicable jurisdiction.
Quick FAQ
| Question | Answer |
|---|---|
| Should I use gross profit or net profit? | Use whichever profit measure is appropriate for your analysis, but keep it consistent for both periods. |
| Can I compare different months? | You can, but the result is more reliable when the months have similar demand patterns, pricing, and operating conditions. |
| What if the business was already trending up or down? | A simple before-and-after comparison may be too basic; you may need a more tailored baseline outside this calculator. |