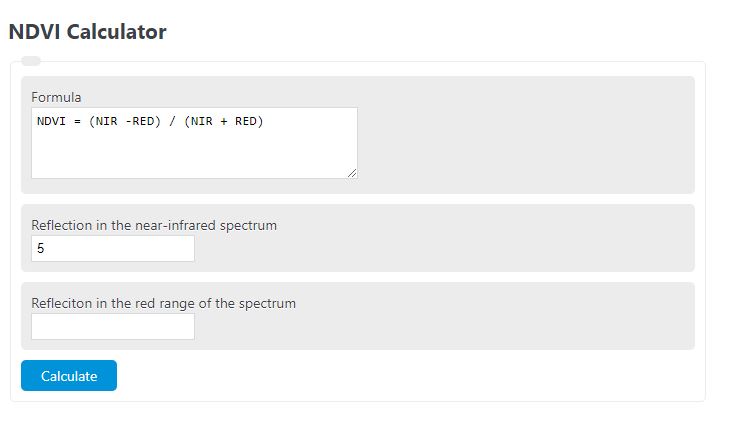
Calculate NDVI from near-infrared and red reflectance, or find the missing value when any two of the three inputs are known using the NDVI formula.
- Basal Area Calculator
- All Biology Calculators
- Acres Per Hour (mowing) Calculator
- Satellite Coverage Area Calculator
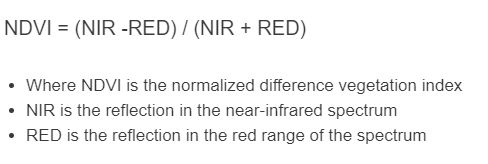
NDVI Formula
The normalized difference vegetation index (NDVI) is a ratio used to estimate vegetation presence, vigor, and canopy activity from reflectance data. It compares how strongly a surface reflects near-infrared light versus red light. Healthy vegetation typically reflects more near-infrared and absorbs more red light, which produces a higher NDVI value.
- NDVI = normalized difference vegetation index
- NIR = reflectance in the near-infrared band
- RED = reflectance in the red band
In most practical remote sensing workflows, NDVI falls between negative one and positive one. Values closer to the upper end generally indicate stronger live vegetation response, while values near zero or below zero often indicate bare ground, water, cloud, snow, or other non-vegetated surfaces.
Rearranged Forms
Because this calculator can solve for any missing variable when the other two are known, the equation can also be rearranged as follows:
These forms are useful when you already know the index and one reflectance value and want to estimate the other band value used by the ratio.
How to Interpret NDVI
| Typical NDVI Value | General Interpretation | What It Often Suggests |
|---|---|---|
| Below 0 | Usually non-vegetated | Water, cloud, snow, deep shadow, or highly reflective non-plant surfaces |
| 0 to 0.2 | Very little vegetation | Bare soil, rock, urban areas, residue, or sparse stressed cover |
| 0.2 to 0.5 | Moderate vegetation | Grass, shrubs, emerging crops, or mixed soil-canopy pixels |
| 0.5 to 0.8 | Dense active vegetation | Healthy crops, forest canopy, and well-developed plant cover |
| Above 0.8 | Very dense canopy | Lush vegetation; in some situations values may compress because NDVI can saturate at high biomass |
Important: interpretation depends on crop type, season, soil brightness, irrigation, viewing angle, and the sensor used. A value that is healthy for one field or ecosystem may be weak for another, so NDVI is most useful when compared across time or across similar areas.
How to Use the Calculator
- Enter the reflectance in the near-infrared band and the reflectance in the red band to calculate NDVI.
- If NDVI is already known, enter NDVI and one reflectance value to solve for the other missing variable.
- Use inputs from the same location, same date, and same processing level.
- Keep both reflectance values on the same scale, such as both decimals or both percentages.
- If the two reflectance values sum to zero, the ratio is undefined and the result cannot be computed.
Example
If near-infrared reflectance is 0.62 and red reflectance is 0.18, the NDVI is:
An NDVI of 0.55 generally indicates a strong vegetation signal consistent with healthy, actively growing plant cover.
Why NDVI Is Useful
- Crop monitoring: Track emergence, growth, and stress through the season.
- Drought detection: Falling NDVI can indicate declining canopy activity or moisture stress.
- Land cover analysis: Separate vegetated and non-vegetated areas more easily than with visible imagery alone.
- Forest and rangeland management: Monitor productivity, recovery, and disturbance response.
- Change detection: Compare the same field or parcel over multiple dates to identify trends.
Practical Notes
- Use reflectance, not raw sensor counts, whenever possible. Preprocessed surface reflectance data usually gives more meaningful results.
- Clouds, haze, smoke, and shadows can distort the ratio and should be masked before analysis.
- Bright soil and sparse cover can reduce NDVI even when vegetation is present.
- Mixed pixels lower the index when vegetation shares the pixel with soil, pavement, or residue.
- Very dense canopies can cause NDVI to level off, so small differences at high biomass may be harder to detect.
- Comparisons are strongest when the sensor, date window, and processing workflow are consistent.
FAQ
What is a good NDVI value?
A “good” value depends on context. In general, higher values indicate stronger vegetation response, but the meaning of any single number depends on the crop, season, region, and sensor. Comparing current NDVI against past values from the same area is usually more informative than looking at one value by itself.
Can NDVI be negative?
Yes. Negative values often occur over water, snow, cloud, or deep shadow, where the red and near-infrared response does not resemble living vegetation.
Can I enter percentages instead of decimals?
Yes, as long as both reflectance inputs use the same scale. For example, using 62 and 18 gives the same NDVI as using 0.62 and 0.18 because the ratio is scale-consistent when both bands are measured the same way.
Why does NDVI work for vegetation?
Green vegetation absorbs much of the incoming red light for photosynthesis while reflecting a larger share of near-infrared energy due to internal leaf structure. NDVI converts that contrast into a compact index that is easy to compare across locations and dates.
When should I be careful using NDVI?
Be cautious when imagery contains clouds, smoke, heavy atmospheric effects, strong shadows, bright bare soil, standing water, or very dense canopies. In those cases, NDVI can be less sensitive or can represent background conditions as much as plant health.