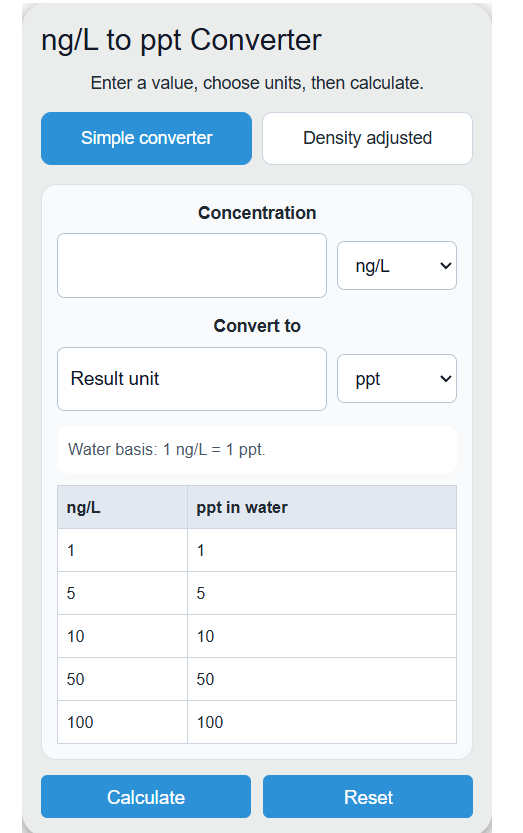
Convert ng/L to ppt and related concentration units, with a density-adjusted mode for converting between ng/L and ppt in water or other samples.
- Ng/Ml To Nm Calculator
- E85 Ethanol Blend Calculator
- mg/l to g/mol Converter
- uiu/ml to iu/ml Converter
- Conductivity ↔ Resistivity Calculator
- All Unit Converters
ng/L to ppt Formula
The following practical relationship is used to convert nanograms per liter (ng/L) to parts per trillion (ppt) for water and other dilute aqueous solutions.
This approximation works because 1 liter of water has a mass of about 1 kilogram. Therefore, 1 nanogram in 1 liter corresponds to a mass fraction of about 10-12, which is 1 part per trillion.
Variables:
- ppt is the concentration in parts per trillion
- ng/L is the concentration in nanograms per liter
- The relationship assumes a water-like density near 1 kg/L
To convert ng/L to ppt, use the same numeric value when the sample is water or a similar dilute aqueous liquid.
What is ng/L to ppt Conversion?
Converting ng/L to ppt is a way of expressing extremely small concentrations in a different but closely related format. Nanograms per liter is a mass-per-volume unit, while parts per trillion is a ratio-based concentration unit. In environmental testing, water quality reporting, and trace contaminant analysis, these two units are often treated as numerically equivalent because water has a density very close to 1 kilogram per liter.
That means a reading of 5 ng/L is approximately 5 ppt, 10 ng/L is approximately 10 ppt, and 50 ng/L is approximately 50 ppt, provided the sample behaves like water.
How to Convert ng/L to ppt?
The following steps outline how to convert ng/L to ppt.
- First, determine the concentration in nanograms per liter (ng/L).
- Next, confirm that the sample is water or another dilute aqueous solution with density close to 1 kg/L.
- Finally, use the relationship ppt ≈ ng/L to find the equivalent value in parts per trillion.
- After inserting the value, check your answer with the calculator above.
Example Problem:
Use the following variables as an example problem to test your knowledge.
Concentration = 10 ng/L
Sample Type = Drinking Water
Result = 10 ppt
ng/L to ppt Conversion Table
The table below lists sample conversions using the approximation ppt ≈ ng/L for water and water-like solutions.
| Concentration (ng/L) | Assumed Medium | Approximate Value in ppt |
|---|---|---|
| 1 ng/L | Water at 1.00 kg/L | 1 ppt |
| 5 ng/L | Drinking water | 5 ppt |
| 10 ng/L | Surface water | 10 ppt |
| 25 ng/L | Groundwater | 25 ppt |
| 50 ng/L | Seawater (approximate) | 50 ppt |
| 100 ng/L | Other dilute aqueous sample | 100 ppt |
Environmental reports, laboratory analyses, and regulatory guidelines may use either ng/L or ppt when discussing trace contaminant levels. For water-based samples, understanding that these units are effectively interchangeable makes it easier to compare data across reports and standards.