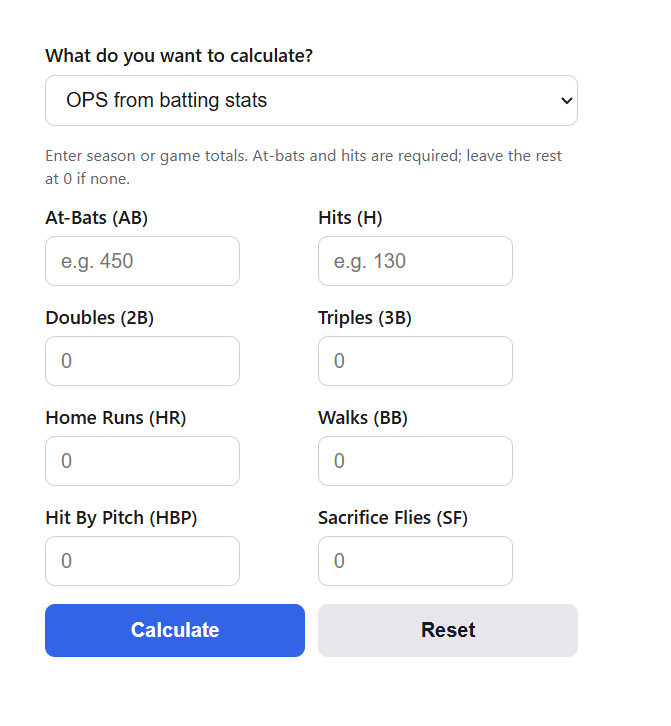
Calculate OPS (on-base plus slugging) from raw batting stats or OBP and SLG, plus league-adjusted OPS+ to rate any hitter against the league.
OPS Formula
OPS = OBP + SLG
OBP = (H + BB + HBP) / (AB + BB + HBP + SF)
SLG = (1B + 2*2B + 3*3B + 4*HR) / AB
OPS+ = 100 * (OBP/lgOBP + SLG/lgSLG - 1)
- OPS is on-base plus slugging
- OBP is on-base percentage and SLG is slugging percentage
- H is hits, BB is walks, HBP is hit by pitch, AB is at-bats, SF is sacrifice flies
- 1B, 2B, 3B, and HR are singles, doubles, triples, and home runs, where 1B = H – 2B – 3B – HR
- The numerator of SLG is total bases (TB)
- lgOBP and lgSLG are the league-average OBP and SLG for the same season
The calculator has three modes. The batting stats mode takes raw totals (AB, H, 2B, 3B, HR, BB, HBP, SF), builds OBP and SLG from the first two formulas, and adds them to get OPS. It also reports batting average, singles, and total bases so you can check each step. The OBP and SLG mode adds two rates you already know, which is useful when reading a stat sheet. The OPS+ mode applies the last formula to compare a hitter against the league: it divides the player’s OBP and SLG by the league averages, so a result of 100 is exactly average and every point above or below is roughly one percent better or worse than the league.
OPS Rating Scale and MLB League Averages by Season
The first table shows how an OPS is typically judged against major league standards.
| OPS | Rating |
|---|---|
| 1.000 or higher | Elite, MVP caliber |
| .900 to .999 | Excellent |
| .800 to .899 | Great |
| .750 to .799 | Above average |
| .700 to .749 | Roughly MLB average |
| .650 to .699 | Below average |
| Below .650 | Poor |
The second table lists approximate MLB league-wide averages over the last decade. These are the numbers to enter as lgOBP and lgSLG in the calculator’s OPS+ mode, and they also show why context matters: an .800 OPS meant more in 2022, when the league OPS was around .706, than in 2019, when it was around .758.
| Season | League OBP | League SLG | League OPS |
|---|---|---|---|
| 2015 | .317 | .405 | .721 |
| 2016 | .322 | .417 | .739 |
| 2017 | .324 | .426 | .750 |
| 2018 | .318 | .409 | .728 |
| 2019 | .323 | .435 | .758 |
| 2020 | .322 | .418 | .740 |
| 2021 | .317 | .411 | .728 |
| 2022 | .312 | .395 | .706 |
| 2023 | .320 | .414 | .734 |
| 2024 | .312 | .399 | .711 |
The 2020 season was shortened to 60 games, so its averages come from a much smaller sample than the other seasons.
Example Problems
Example 1: OPS from batting stats. A player finishes the season with 450 at-bats, 130 hits, 28 doubles, 3 triples, 22 home runs, 55 walks, 6 hit by pitches, and 4 sacrifice flies. First find singles: 130 – 28 – 3 – 22 = 77. Total bases are 77 + 2(28) + 3(3) + 4(22) = 230. OBP = (130 + 55 + 6) / (450 + 55 + 6 + 4) = 191 / 515 = .371. SLG = 230 / 450 = .511. OPS = .371 + .511 = .882, a great season by MLB standards.
Example 2: OPS+ for the same player. Using 2024 league averages (lgOBP = .312, lgSLG = .399): OPS+ = 100 x (.371/.312 + .511/.399 – 1) = 100 x (1.189 + 1.281 – 1) = 147. This hitter produced about 47% more than a league-average hitter, even though his raw OPS of .882 is below the .900 “excellent” line on the rating scale.
FAQ
What is a good OPS?
In the majors, anything above .800 is a strong season and above .900 is excellent; the league as a whole usually sits between .700 and .760. At lower levels the bar shifts up because pitching is weaker: good high school and youth players often post an OPS above 1.000, so judge the number against the level of competition rather than against MLB alone.
What is the difference between OPS and OPS+?
OPS is the raw sum of OBP and SLG, so it ignores the run environment of the season and ballpark. OPS+ rescales the number so that 100 is always league average, which lets you compare hitters across different seasons. The calculator’s OPS+ mode adjusts for the league averages you enter; the official MLB version also applies a ballpark adjustment, so published OPS+ figures can differ slightly from the league-only version here.
Why do OBP and SLG use different denominators?
OBP measures how often a player avoids making an out per plate appearance, so its denominator adds walks, hit by pitches, and sacrifice flies to at-bats. SLG measures bases gained per official at-bat only, so walks and hit by pitches do not appear in it at all. This is also why OPS is only an approximation of offensive value: adding two rates with different denominators slightly undervalues getting on base, which is one reason stats like wOBA exist.