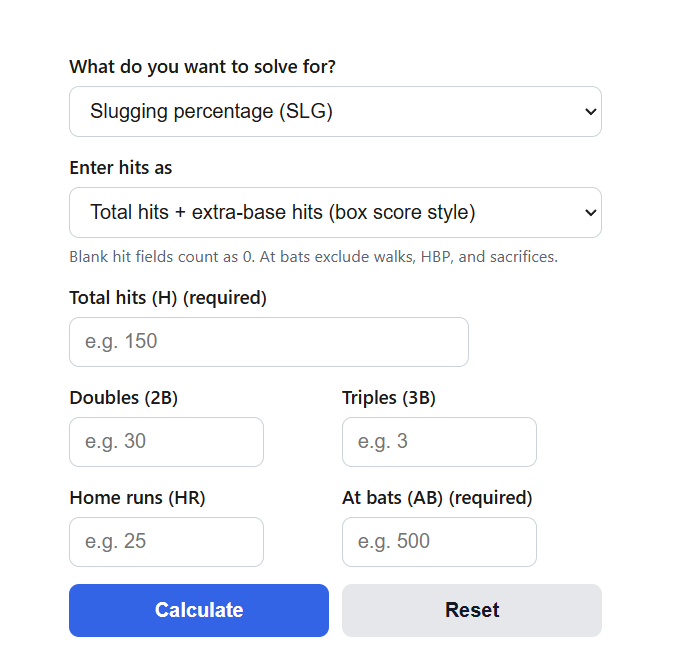
Calculate slugging percentage (SLG) from hits, doubles, triples, and home runs, plus total bases, ISO, and the bases needed to hit a target SLG.
Slugging Percentage Formula
SLG = (1B + 2*2B + 3*3B + 4*HR) / AB
- SLG is the slugging percentage, shown as a decimal to three places (for example .522)
- 1B is the number of singles
- 2B is the number of doubles
- 3B is the number of triples
- HR is the number of home runs
- AB is the number of at bats (walks, hit by pitch, sacrifices, and catcher’s interference do not count)
The numerator of the formula is total bases (TB): one base for a single, two for a double, three for a triple, and four for a home run. Box scores usually report total hits (H) rather than singles, so the calculator’s default entry mode lets you type H, 2B, 3B, and HR and derives singles for you:
1B = H - 2B - 3B - HR
Along with SLG, the calculator returns total bases, derived singles, batting average (AVG = H / AB), isolated power (ISO = SLG – AVG), and a rating of the result against recent MLB league averages. The second mode inverts the formula to plan ahead: it computes how many total bases you need to reach a target SLG.
TB needed = Target SLG * (AB so far + upcoming AB) - TB so far
Enter the target SLG and your at bats, optionally including your current at bats and total bases, and the result is the number of total bases required over your upcoming at bats, rounded up to the next whole base, plus the equivalent counts in singles, doubles, or home runs.
SLG Benchmarks and MLB League Averages by Season
Use the first table to judge a result against major league norms. The league as a whole has slugged roughly .395 to .435 over the last decade, so treat .400 as the modern anchor for average.
| SLG range | Interpretation (MLB context) |
|---|---|
| Under .340 | Well below average |
| .340 to .379 | Below average |
| .380 to .429 | About average |
| .430 to .489 | Above average |
| .490 to .549 | Great, All-Star range |
| .550 and up | Elite, MVP caliber |
The second table shows the actual MLB league-average slugging percentage season by season (both leagues combined, per Baseball Almanac league totals). It is a better yardstick than a single-year number because the league environment moves: the 2019 juiced-ball season ran 36 points higher than the pitching-friendly 2022 season.
| Season | MLB average SLG | Season | MLB average SLG |
|---|---|---|---|
| 2016 | .417 | 2021 | .411 |
| 2017 | .426 | 2022 | .395 |
| 2018 | .409 | 2023 | .414 |
| 2019 | .435 | 2024 | .399 |
| 2020 (60 games) | .418 | 2025 | .404 |
Example Problems
Example 1: a hitter finishes the season with 150 hits in 500 at bats, including 30 doubles, 3 triples, and 25 home runs. First derive singles: 1B = 150 – 30 – 3 – 25 = 92. Total bases = 92 + 2(30) + 3(3) + 4(25) = 92 + 60 + 9 + 100 = 261. SLG = 261 / 500 = .522. Batting average is 150 / 500 = .300, so isolated power is .522 – .300 = .222, a strong power profile.
Example 2: a player is slugging .380 through 100 at bats (38 total bases) and wants to finish at .450 with 100 at bats left in the season. Total bases needed = .450 * (100 + 100) – 38 = 90 – 38 = 52. Over the remaining 100 at bats that is a .520 SLG, which any mix of hits worth 52 total bases achieves, for example 13 home runs, 26 doubles, or 52 singles.
Frequently Asked Questions
Why is it called a percentage if it can be greater than 1?
The name is a historical quirk. SLG is really an average, total bases per at bat, not a share out of 100. It runs from .000 (no hits) to a theoretical maximum of 4.000, which would mean a home run in every at bat. The single-season MLB record is Barry Bonds’s .863 in 2001, and since MLB incorporated Negro Leagues statistics in 2024, the career record belongs to Josh Gibson at .718, ahead of Babe Ruth’s .690.
What counts as an at bat in the formula?
An at bat is a completed plate appearance minus walks, hit by pitch, sacrifice bunts, sacrifice flies, and catcher’s interference. That is why a player’s at bat total is smaller than their plate appearance total, and why SLG ignores walks entirely. If you use plate appearances in the denominator by mistake, the result will understate the true slugging percentage.
How is SLG different from OPS and ISO?
SLG measures only what happens on hits, so it says nothing about how often a hitter reaches base by walk. OPS fixes that by adding on-base percentage to slugging (OPS = OBP + SLG). ISO strips batting average out of slugging (ISO = SLG – AVG) to isolate extra-base power: a .300 hitter with all singles has a .000 ISO, while roughly .140 to .150 is a typical MLB ISO and .200 or more marks a legitimate power hitter. The calculator reports ISO automatically whenever it computes SLG.