Calculate percent deviation between a true value and measured value, or solve for the missing true or measured value from two inputs.
- All Statistics Calculators
- Chemical Yield Calculator
- Percentage Difference Calculator
- Relative Error Calculator
- Relative Standard Deviation Calculator
Percent Deviation Formula
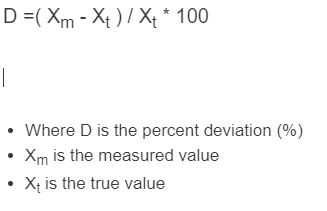
The primary formula compares a single measured value against a known true value:
- D = percent deviation (%)
- Xm = measured value
- Xt = true (accepted) value
A second form measures dataset consistency when no theoretical value exists, using the sample mean as the reference:
MAD (mean absolute deviation) = the average of |each data point minus the mean| across all values in the set.
Two Interpretations of Percent Deviation
| Interpretation | Reference Point | When to Use |
|---|---|---|
| Single measurement vs. known value | Known or accepted true value | Lab results, calibration checks, chemical yields |
| Dataset spread around its own mean | Sample mean | Repeated measurements when no theoretical value is available |
Percent Deviation vs. Percent Error vs. Relative Error
| Metric | Formula | Reference | Result |
|---|---|---|---|
| Percent Deviation | (Xm – Xt) / Xt x 100 | True value or sample mean | Signed or absolute (%) |
| Percent Error | |Xm – Xt| / Xt x 100 | Theoretical value | Always positive (%) |
| Relative Error | (Xm – Xt) / Xt | True value | Signed decimal (unitless) |
Percent error and percent deviation use identical arithmetic. The key distinction: percent error always takes the absolute value (magnitude only), while percent deviation preserves the sign to show direction of error. Relative error is the same ratio as percent error expressed as a decimal rather than a percentage.
Acceptable Percent Deviation by Field
What qualifies as an acceptable deviation varies by discipline and the precision required. Industry benchmarks:
| Field | Acceptable % Deviation | Standard / Basis |
|---|---|---|
| Pharmaceutical (main analyte, HPLC) | ≤2% RSD | USP <621> |
| Pharmaceutical (related substances) | ≤5% RSD | USP <621> |
| Analytical chemistry (at LOQ) | ≤10% | Method validation guidelines |
| Clinical laboratory | <10% CV | General laboratory QC |
| Calibration verification | <5% | Instrument QC practice |
| High-precision manufacturing | <0.1 to 2% | Design tolerance (application-specific) |
| Agricultural / environmental sampling | 10 to 30% | Field variability tolerances |
Signed vs. Absolute Deviation
A signed result preserves direction: negative means the measurement fell below the true value; positive means above. Quality control processes track signed deviation to detect systematic bias (e.g., an instrument consistently reading low). Tolerance checks typically use absolute deviation to determine whether the error magnitude is within spec, regardless of direction.
Percent Deviation Example
A chemical reaction has an expected yield of 55 g. The measured yield is 50 g.
D = (50 – 55) / 55 x 100 = -9.09%
The negative sign confirms the result was below the expected value. The absolute deviation of 9.09% exceeds the typical analytical chemistry threshold of ≤5%, which would prompt investigation in a controlled lab setting.
FAQ
A percent deviation is the percentage difference between a measured value and a reference value, either a known true value or the mean of a dataset. It quantifies how far off a measurement is relative to the reference.
A negative percent deviation means the measured value is below the true or expected value. A result of -9.09% means the measurement was 9.09% lower than expected. Tracking the sign matters when detecting systematic underbias in instruments or processes.
Percent error always takes the absolute value of the difference, producing a strictly positive result that measures magnitude only. Percent deviation can be signed, preserving directional information. Both use the same underlying formula and the same reference value.
It depends on the field. Pharmaceutical testing requires ≤2% RSD for main analytes under USP <621>. Clinical labs generally accept <10% CV. Calibration verification flags results above 5%. High-precision manufacturing may require <0.1 to 2%. Environmental or agricultural sampling may tolerate 10 to 30%.
Yes. If a measured value is more than double the true value, or if the true value is zero or near-zero, percent deviation can exceed 100% or become undefined. For this reason, percent deviation is most informative when the true value is nonzero and the measurement is within a reasonable range relative to it.