Calculate QC ranges from a mean and coefficient of variation, or find CV and the missing upper or lower range from two entered values.
Related Calculators
- Critical Difference Calculator
- Coefficient Of Dispersion Calculator
- Index of Dispersion Calculator
- Relative Accuracy Calculator
- All Statistics Calculators
QC Range Formula
The QC range estimates an expected interval around a mean using the coefficient of variation. In practice, this calculator helps you turn a target mean and a CV percentage into an upper bound and a lower bound so you can quickly judge whether a result is staying within the expected amount of variation.
Because the calculator produces a band rather than a single number, it is often most useful to view the result as two limits:
This is equivalent to taking the mean and moving two CV-based standard deviations above and below it. If you first convert the coefficient of variation into an absolute standard deviation, the relationship becomes:
Variable Definitions
| Variable | Meaning | Notes |
|---|---|---|
| M | Mean | The target or average value for the process, sample set, or control material. |
| CV | Coefficient of Variation (%) | A relative measure of spread expressed as a percent of the mean. |
| Upper Range | High acceptable bound | The mean plus the allowed variation. |
| Lower Range | Low acceptable bound | The mean minus the allowed variation. |
How to Calculate the QC Range
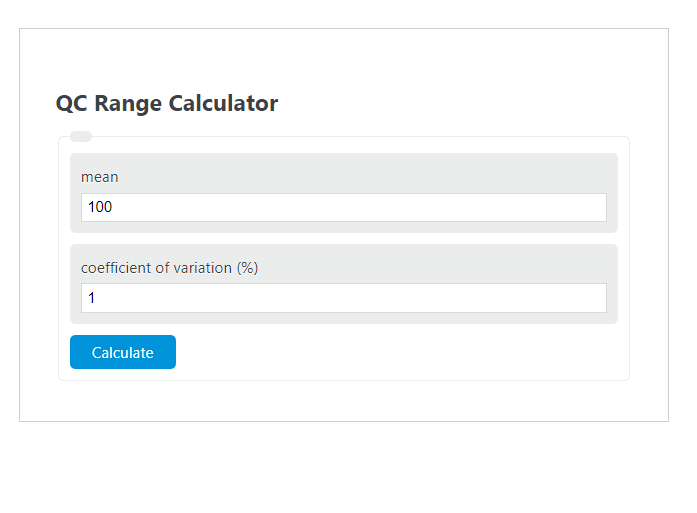
- Enter the mean value.
- Enter the coefficient of variation as a percentage, not as a decimal.
- Convert the CV percent into an absolute spread by multiplying the mean by the CV divided by 100.
- Multiply that spread by 2 to create the QC interval width on each side of the mean.
- Add the result to the mean for the upper range and subtract it from the mean for the lower range.
Example Calculation
If the mean is 30 and the coefficient of variation is 2.5%, first convert the CV into an absolute standard deviation-like amount:
Next, calculate twice that amount:
Now compute the upper and lower limits:
So the QC range is from 28.5 to 31.5.
How to Interpret the Result
- Inside the range: the observed value is within the expected variation implied by the mean and CV.
- Above the upper range: the result is higher than expected and may justify a review of process stability, measurement conditions, or input assumptions.
- Below the lower range: the result is lower than expected and may indicate the same type of issue in the opposite direction.
When This Calculator Is Useful
- Checking whether a measurement falls within an expected variation band.
- Setting quick screening limits from a known mean and CV.
- Comparing process results against a target average.
- Translating a relative variability percentage into practical upper and lower bounds.
Common Input Mistakes
- Entering CV as a decimal: if the CV is 2.5%, enter 2.5, not 0.025.
- Using inconsistent units: the upper and lower range will use the same units as the mean.
- Confusing total range with one-sided adjustment: the amount computed from the formula is applied both above and below the mean.
- Using a mean near zero: CV-based interpretation becomes less informative when the mean is extremely small.
Quick Reference
| Task | Result |
|---|---|
| Convert CV percent to an absolute spread | ((CV) / (100))M |
| Find the upper limit | M + 2((CV) / (100))M |
| Find the lower limit | M - 2((CV) / (100))M |
FAQ
Does the calculator return one value or two?
The practical output is a lower limit and an upper limit, which together define the QC range.
Why is the multiplier 2 used?
The formula builds a band that extends two CV-based standard deviations above and below the mean.
What unit is the answer in?
The output stays in the same unit as the mean because the percentage variation is converted back into an absolute amount.
Can the lower range be negative?
Yes, if the mean is small relative to the allowed variation. Whether that makes sense depends on the quantity being measured.