Calculate risk difference between treatment and control groups from event counts or risks, plus NNT/NNH and per-1,000 people impact.
For educational purposes only. This calculator does not provide medical advice. Interpret risk difference and NNT/NNH in the context of the outcome definition and follow-up period, and consult qualified professionals and primary epidemiology/biostatistics references (e.g., CDC/NIH or university resources) when appropriate.
- All Statistics Calculators
- Cumulative Incidence Calculator
- Infection Rate Calculator
- Incidence Rate Calculator
- Prevalence Calculator
- Absolute Risk Reduction Calculator
- Survival Rate Calculator
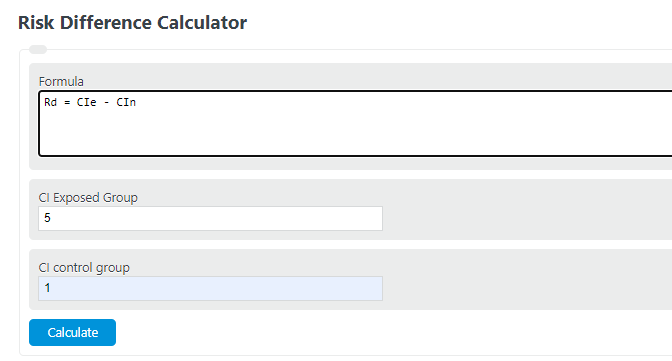
Risk Difference Formula
The following formula is used to calculate a risk difference.
- Where Rd is the risk difference
- CIe is the cumulative incidence of the exposed group
- CIn is the cumulative incidence of the non-exposed or control group
To calculate a risk difference, subtract the cumulative incidence of the control group from the cumulative incidence of the exposed group. A positive result indicates the exposed group carried more risk. A negative result indicates the exposed group had less risk, which is the expected pattern in randomized controlled trials evaluating a protective treatment or vaccine.
Risk Difference Definition
A risk difference is the difference between the cumulative incidence (risk) of a group exposed to an outcome and those not exposed (the control group). It is an absolute measure of effect, expressing the excess risk attributable to the exposure in units of proportion or percentage points. A risk difference of 0.05 means the exposed group experienced 5 more cases per 100 people than the control group over the observation period.
Risk difference is also called absolute risk difference, absolute risk reduction (ARR) in clinical trial contexts, and attributable risk in epidemiology. When expressed as a proportion of the exposed group’s total risk, it becomes the attributable proportion: the fraction of the exposed group’s cases that would not have occurred without the exposure. These are the same calculation applied with different interpretive framing depending on the research question.
Risk Difference vs. Risk Ratio vs. Odds Ratio
Three measures dominate how researchers communicate risk in epidemiology and clinical research. Each answers a different question and has different appropriate uses depending on study design and the nature of the outcome.
The risk ratio (relative risk) asks: how many times higher is the risk in the exposed group compared to the unexposed group? If the exposed group has a 30% risk and the unexposed group has a 10% risk, the risk ratio is 3.0. The risk difference asks: by how much does the exposed group’s risk exceed the unexposed group’s risk? Using the same numbers, the risk difference is 0.30 minus 0.10 = 0.20, or 20 percentage points. The odds ratio asks: how many times higher are the odds of the outcome in the exposed group? For common outcomes (prevalence above approximately 10%), odds ratios diverge substantially from risk ratios and tend to overstate the apparent association. The odds ratio approximates the risk ratio only when the outcome is rare in both groups.
| Measure | Formula | Type | Null Value | Primary Use Case |
|---|---|---|---|---|
| Risk Difference (RD) | CIe – CIu | Absolute | 0 | Cohort studies and RCTs; quantifies excess cases per person |
| Risk Ratio (RR) | CIe / CIu | Relative | 1 | Cohort studies and RCTs; measures strength of association |
| Odds Ratio (OR) | (a x d) / (b x c) | Relative | 1 | Case-control studies; approximates RR when outcome is rare |
| Rate Difference | IRe – IRu | Absolute | 0 | Person-time data; incidence rate-based studies with variable follow-up |
Risk differences and risk ratios can only be computed in study designs where true population risks are directly observable over a defined follow-up period, specifically cohort studies and randomized controlled trials. Odds ratios are the primary output of case-control studies, where sampling from the outcome stratum makes direct risk calculation impossible without external incidence data.
Why Absolute Risk Difference Often Tells a More Complete Story
Relative risk measures can be technically accurate but practically misleading when reported in isolation. A 50% relative risk reduction sounds equally dramatic whether it reduces absolute risk from 2% to 1%, or from 40% to 20%. These two scenarios carry the same risk ratio but very different clinical and public health implications. In the first case, NNT = 100 (one person benefits per 100 treated). In the second, NNT = 5. The relative number communicates nothing about which situation you are in.
This distinction has documented consequences in medical reporting. A 2011 review of 316 randomized trials found that 44% of positive, statistically significant trials reported only relative risk measures in their abstracts without any absolute risk data. Pharmaceutical marketing has historically favored relative risk reductions because they consistently produce larger, more favorable-sounding numbers than the corresponding absolute risk differences.
COVID-19 vaccine trial reporting illustrated this dynamic clearly. Trials reporting relative efficacies between 67% and 95% corresponded to absolute risk reductions that varied substantially across trials, reflecting differences in baseline incidence of severe disease in each study population. A vaccine with 95% relative efficacy against rare severe disease reduces absolute risk by a small number of percentage points; the same vaccine facing a 30% baseline incidence would produce a much larger absolute risk reduction. Neither number is wrong. The relative efficacy captures how protective the vaccine is against the comparator condition; the absolute risk reduction captures how frequently the benefit is realized given the study population’s actual disease burden. For population-level policy decisions (who to vaccinate, at what cost, in what sequence), both numbers are essential inputs.
A practical interpretive rule: always request the baseline risk in the control group alongside any relative risk measure. Without the control group incidence, a risk ratio or relative risk reduction conveys no information about the absolute magnitude of effect.
Number Needed to Treat and Number Needed to Harm
The number needed to treat (NNT) is the reciprocal of the absolute risk reduction. If a treatment reduces the risk of an outcome by 5 percentage points (risk difference = 0.05), the NNT is 1 / 0.05 = 20. This means 20 people must receive the treatment for one additional person to benefit who would not have benefited without it. NNT is the most commonly used metric in clinical medicine for communicating the practical significance of therapeutic interventions, and it is always derived from a risk difference, never from a risk ratio.
The number needed to harm (NNH) applies the same concept when an exposure increases risk. If an exposure increases risk by 0.02 (2 percentage points), the NNH is 1 / 0.02 = 50: on average, 50 people must be exposed for one additional harmful outcome to occur that would not have occurred otherwise. NNT and NNH are always defined relative to a specific follow-up period and a specific outcome. An NNT of 20 to prevent one heart attack over 5 years is a very different clinical finding from an NNT of 20 to prevent one headache over 1 week.
Sign interpretation: when RD is positive (exposed group has higher risk than control), the reciprocal gives NNH. When RD is negative (exposed group has lower risk, as in a treatment arm versus placebo), the reciprocal of the absolute value gives NNT. When RD equals zero, risks are identical between groups and neither NNT nor NNH is defined because there is no excess risk to attribute.
Study Design and When Risk Difference Can Be Calculated
Risk differences require study designs where absolute risks are directly observable. This is possible in cohort studies (both prospective and retrospective) and randomized controlled trials, where defined populations are followed over time and event rates in exposed and unexposed subgroups are measured directly. Randomized controlled trials are a special case of cohort study where exposure is assigned rather than observed, which eliminates confounding by indication and gives RD estimates a causal interpretation under standard assumptions.
Case-control studies cannot produce risk differences without external data. These studies begin with the outcome (selecting cases who experienced the event and controls who did not) and examine prior exposure. Because the ratio of cases to controls is set by the investigator and does not reflect population incidence, the absolute risk in the exposed group cannot be estimated from the study alone. Case-control studies report odds ratios. When the outcome is rare in the general population, the OR approximates the RR, but no valid conversion from OR to RD exists without knowing the baseline population incidence from an independent source such as a disease registry or census-based denominator.
Cross-sectional studies can calculate prevalence differences (the point-in-time analogue of risk differences) but not incidence-based risk differences, because no follow-up period is observed and the temporal sequence between exposure and outcome cannot be established from cross-sectional data alone.
Population Attributable Risk
The risk difference quantifies excess risk at the individual level: each exposed person carries RD additional risk compared to a non-exposed person over the defined follow-up period. The population attributable risk (PAR) extends this to the entire population, estimating how much of the total disease burden is attributable to the exposure when the full distribution of exposed and unexposed individuals is accounted for.
The calculation is: PAR = prevalence of exposure in the population multiplied by the risk difference. The population attributable fraction (PAF) is PAR divided by total disease incidence in the population, representing the proportion of all cases in the population that would be eliminated if the exposure were completely removed and all else remained constant.
A risk factor with a modest per-person RD can generate a large PAF when exposure is widespread. Smoking and lung cancer is the most studied example. The per-person risk difference between smokers and non-smokers is large, but it was the high prevalence of smoking across mid-20th century populations (exceeding 50% of adults in many countries) that produced PAF estimates above 80% for lung cancer in those cohorts. Conversely, a high-RD risk factor affecting only a small fraction of the population may contribute less total attributable disease burden than a lower-RD factor with near-universal exposure.
This asymmetry shapes public health prioritization. Population-wide interventions targeting modest per-person risk factors (dietary sodium reduction, increased physical activity, improved air quality) can prevent more total disease than targeted interventions addressing high-RD risk factors that affect a small fraction of the population. PAF, not RD alone, is the appropriate input for cost-effectiveness analyses and burden-of-disease calculations used in resource allocation decisions.
Confidence Intervals for Risk Difference
A calculated risk difference from a single study is a sample estimate with statistical uncertainty. Confidence intervals (CIs) quantify that uncertainty. A 95% CI for a risk difference means that if the same study were repeated many times under identical conditions, approximately 95% of the resulting intervals would contain the true population risk difference. The standard 95% CI is approximated as: RD plus or minus 1.96 times the standard error of the RD, where SE(RD) is calculated from the standard errors of the two group risk estimates.
If the 95% CI includes zero, the result is not statistically significant at alpha = 0.05: the observed data are consistent with no true difference between groups. Wider CIs reflect smaller sample sizes or lower event frequencies. A precisely estimated RD near zero is a meaningfully different result from an imprecisely estimated RD near zero: the former rules out a clinically important effect; the latter leaves it unresolved.
The 95% CI for NNT is derived from the CI for RD by taking reciprocals of the CI bounds. When the CI for RD crosses zero (lower bound negative, upper bound positive), the CI for NNT spans from negative infinity through zero to positive infinity. This result is mathematically correct and clinically meaningful: the data are statistically consistent with both benefit and harm, and a point estimate of NNT alone would be misleading. This situation arises frequently in underpowered trials and should trigger caution rather than being treated as a nonsensical output.
FAQ
A risk difference is the difference in risk (cumulative incidence) between an exposed group and a control group. It is an absolute measure of effect that shows how many additional cases of the outcome are attributable to the exposure per unit of the population over the observation period.
Risk difference is the arithmetic subtraction of two risks (RD = risk in exposed minus risk in unexposed) and is an absolute measure. Relative risk is the ratio of two risks and is a relative measure. A 50% relative risk reduction could correspond to an absolute risk change of 0.5 percentage points or 20 percentage points depending on the baseline. Both measures together provide the most complete picture of an association.
Yes. A negative RD means the exposed group had lower risk than the control group, indicating a protective association. This is common in vaccine and drug efficacy studies, where the treatment group experiences fewer events than the placebo group. A negative RD produces an NNT rather than an NNH.
They are the same calculation. In clinical trials the quantity is called absolute risk reduction (ARR). In epidemiological research it is called risk difference (RD). Both equal the arithmetic difference between two cumulative incidences over the same follow-up period.
A risk difference of 0 means the cumulative incidence is identical in the exposed and unexposed groups. There is no excess risk attributable to the exposure. The risk ratio equals 1 in this situation. NNT and NNH are both undefined because there is no differential outcome between the groups.