Calculate Simpson’s diversity index from species population counts and see D, 1 − D, reciprocal index, richness, evenness, and dominance.
- All Biology Calculators
- Relative Abundance Calculator
- Species Richness Calculator
- Population Density Calculator
- Berger-Parker Index Calculator
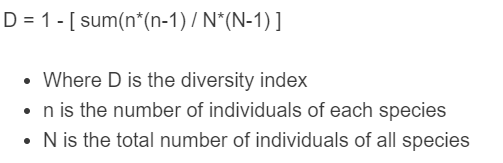
Simpson’s Diversity Index Formula
Simpson’s Diversity Index measures biodiversity by combining richness (how many species are present) and evenness (how evenly individuals are distributed among those species). This calculator uses the common diversity form, so higher values mean greater diversity.
- D: Simpson’s diversity index returned by the calculator
- ni: number of individuals in the i-th species
- N: total number of individuals across all species
In practical terms, the result can be interpreted as the probability that two individuals randomly selected from the sample belong to different species. A value close to 0 indicates low diversity, while a value close to 1 indicates high diversity.
Related Simpson Measures
You may see Simpson’s index written in different but closely related forms. The table below shows the most common versions.
| Measure | Formula | Interpretation |
|---|---|---|
| Dominance form | λ = (Σ nᵢ(nᵢ - 1)) / (N(N - 1)) |
Probability that two selected individuals are from the same species. Larger values mean lower diversity. |
| Diversity form | D = 1 - λ |
Probability that two selected individuals are from different species. Larger values mean higher diversity. |
| Reciprocal form | (1) / (λ) |
A scaled version often used when comparing communities with different levels of dominance. |
Because notation varies across textbooks, two formulas may both be labeled “Simpson’s Index.” What matters most is whether the reported value increases with diversity or decreases with diversity. This calculator reports the version that increases as diversity increases.
How to Calculate Simpson’s Diversity Index
-
Add all species counts to find the total number of individuals.
N = Σ nᵢ
-
Compute the within-species pairing term for each species and sum them.
Σ nᵢ(nᵢ - 1)
-
Compute the total pairing denominator for the full sample.
N(N - 1)
-
Divide the summed within-species term by the total pairing term, then subtract from 1.
D = 1 - (Σ nᵢ(nᵢ - 1)) / (N(N - 1))
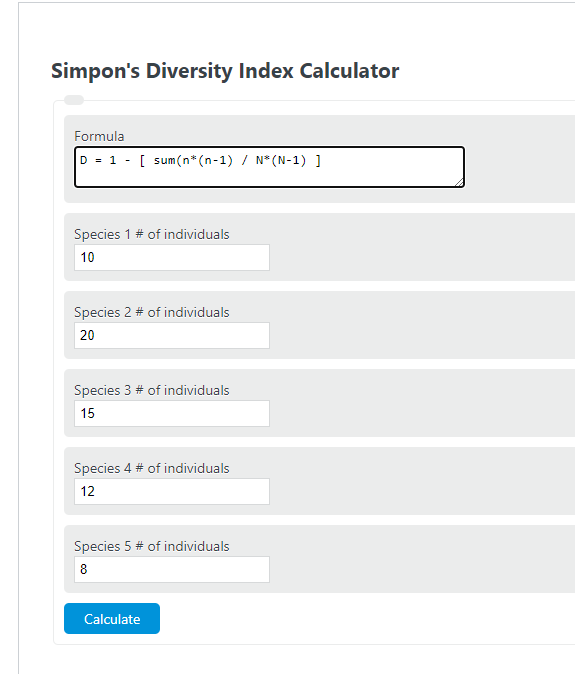
Example Calculation
Suppose the sample contains 5 species with counts of 10, 20, 15, 12, and 8.
A result of 0.7913 indicates relatively high diversity in the sample, meaning the community is not dominated by a single species and individuals are fairly well distributed across the species present.
How to Interpret the Result
- Near 0: very low diversity; one species dominates most of the sample.
- Near 1: high diversity; individuals are spread more evenly across species.
- Same richness, different balance: two samples can contain the same number of species, but the one with more even counts will have the higher Simpson value.
- More sensitive to common species: Simpson’s index gives greater weight to abundant species than to rare ones, which makes it useful when dominance matters.
Why This Index Is Useful
Simpson’s Diversity Index is widely used in ecology, environmental monitoring, microbiology, and any classification problem where you want to describe how concentrated or balanced a population is. It is especially helpful when species abundance matters, not just the number of species present.
- Species richness alone tells you how many categories exist.
- Simpson’s index tells you how evenly the individuals are spread across those categories.
- Community comparisons become more informative because two habitats with the same richness may have very different diversity profiles.
Practical Notes for Using the Calculator
- Enter the count for each species as a non-negative whole number.
- Unused species fields can be left blank.
- The total sample should contain at least two individuals; otherwise the denominator becomes zero and the index cannot be computed meaningfully.
- This page accepts up to five species counts at one time.
- For fair comparisons between sites or time periods, use similar sampling effort, area, and collection methods.
Simpson’s Index vs. Species Richness
Species richness only counts how many species are present. Simpson’s Diversity Index goes further by incorporating abundance, so it distinguishes between a community where species are evenly represented and one where a single species dominates. That makes it a stronger measure when you want a more realistic picture of biodiversity rather than a simple species count.