Calculate slew rate, 90% or 10% signal voltage, or change in time from any three known values in volts, mV, s, ms, or µs for electronics.
- All Physics Calculators
- RMS Voltage (VRMS) Calculator
- Ripple Voltage Calculator
- Peak Voltage Calculator
- Parallel Impedance Calculator
Slew Rate Formula
The slew rate calculator determines how quickly an output voltage changes over a measured time interval. For most waveform measurements, the useful transition window is the span between the 10% and 90% voltage levels, because it captures the steep middle portion of the edge and is easier to measure consistently.
If you know the time at each threshold instead of the elapsed time directly, first compute the difference:
For a standard 10%-to-90% rise-time measurement of a step with amplitude Vstep, the voltage change across the interval is 80% of the full step:
| Term | Meaning | Common Units |
|---|---|---|
| SR | Slew rate, or rate of voltage change | V/s, V/ms, mV/ms, mV/s, V/µs |
| V90 | Output voltage at the 90% point of the transition | V, mV |
| V10 | Output voltage at the 10% point of the transition | V, mV |
| Δt | Elapsed time between the 10% and 90% points | s, ms, µs |
Rearranged Equations
Because the calculator can solve for a missing variable, these equivalent forms are also useful:
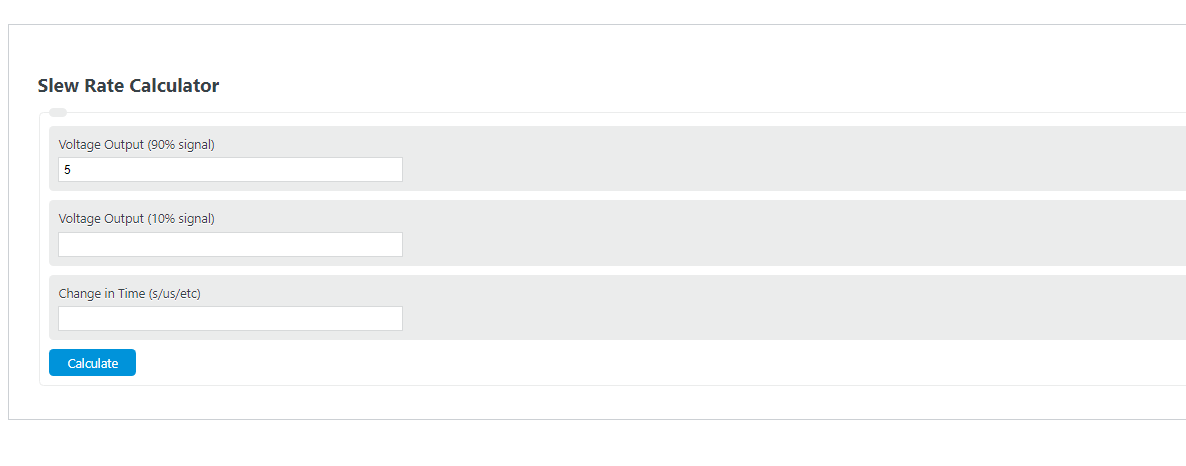
How to Use the Slew Rate Calculator
- Enter the output voltage at the 90% point.
- Enter the output voltage at the 10% point.
- Enter the time required to move between those two levels.
- Select the units that match your measurement setup.
- Calculate the missing value.
If you are measuring from an oscilloscope, place one cursor at the 10% level and another at the 90% level, then use the time difference between those markers as the input for Δt.
Example Calculation
If an output rises from 2 V at the 10% point to 10 V at the 90% point in 10 µs, the change in voltage is 8 V. The slew rate is:
This means the signal is changing at 0.8 volts per microsecond over that measured interval.
What the Result Means
A larger slew rate means the circuit can change its output voltage more quickly. This is important in large-signal conditions where the output must move fast enough to follow a step, pulse, or high-frequency waveform without visibly rounding the edge.
- Higher slew rate: better ability to reproduce fast voltage transitions.
- Lower slew rate: greater chance of edge rounding, rate limiting, or large-signal distortion.
- Measured calculator result: the average slope across the interval you entered.
Required Slew Rate for Sine Waves
For sinusoidal signals, the minimum slew rate needed to reproduce the waveform without slew-induced distortion is:
If you know peak-to-peak voltage instead of peak voltage, use:
This relationship is useful when checking whether an amplifier can support a desired output amplitude at a given frequency.
Why 10% and 90% Are Used
The 10%-to-90% window avoids the flatter beginning and ending parts of a transition, where noise, settling, and trigger uncertainty can distort a measurement. Using the middle portion of the edge gives a more repeatable estimate of the meaningful voltage-change rate.
Practical Tips
- Use the same voltage unit for both voltage inputs before calculating.
- Enter the elapsed time between thresholds, not the total pulse width or signal period.
- Check decimal placement carefully when using microseconds or millivolts.
- For falling edges, the mathematical slope is negative, but slew rate is often reported as a magnitude.
- If your measured value seems unusually high, verify that you did not enter absolute timestamps instead of the time difference.
Applications
Slew rate calculations are commonly used when evaluating:
- Operational amplifiers
- Power amplifiers
- Signal conditioning circuits
- Pulse and step-response measurements
- ADC and DAC driver stages
- General waveform integrity and large-signal behavior