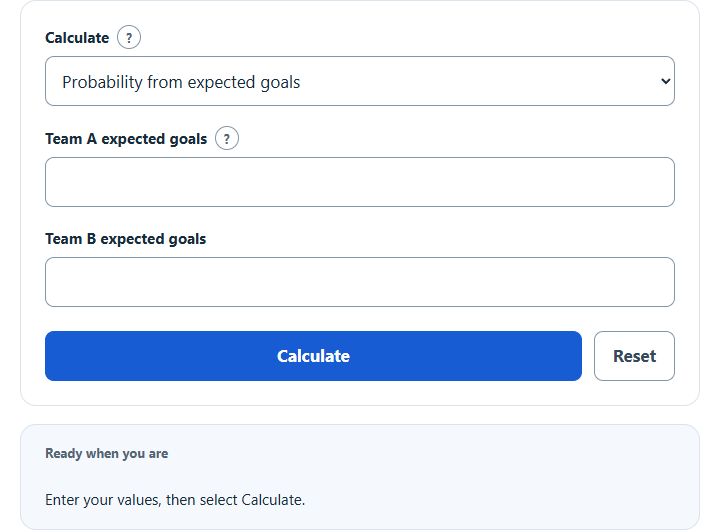
Calculate the win, draw and loss probability of a soccer match from each team’s expected goals, or from the 1X2 betting odds with the margin removed.
- All Soccer Calculators
- Soccer League Points Calculator
- Implied Probability Calculator
- Goals Per 90 Calculator
- Betting Expected Value Calculator
- Football Win Probability Calculator
Calculator Functions
The calculator gives the chance of a win, a draw and a loss in a soccer match, as percentages that add up to 100%, with the fair decimal odds for each result. Select a function to open it in the calculator.
| Function | Use it when | You enter |
|---|---|---|
| Probability from expected goals | You have an idea of how many goals each team should score | Expected goals for Team A and Team B |
| Probability from 1X2 odds | You have a bookmaker’s prices for the match | Decimal odds for a Team A win, a draw and a Team B win |
From expected goals, the calculator also shows the most likely score, the chance of more than 2.5 goals and the chance that both teams score. From odds, it shows the bookmaker margin it removed. To convert a single price, use the Implied Probability Calculator.
Soccer Win Probability Formulas
P(i–j) = PA(i) × PB(j)
| P(k) | Chance that a team scores exactly k goals |
| λ | That team’s expected goals in the match |
| k! | k factorial: 1 × 2 × … × k, with 0! = 1 |
| P(i–j) | Chance of the score i–j, with Team A scoring i and Team B scoring j |
Probability from expected goals
Each team’s goals follow a Poisson distribution, and the two scores are treated as independent [1]. The chance of a Team A win is the sum of P(i–j) over every score where i is greater than j. A draw is the sum where i equals j, and a Team B win is the rest. With 1.6 expected goals against 1.1, that gives 49.0% for Team A, 24.9% for a draw and 26.2% for Team B.
Expected goals are your estimate for this match. A team’s average goals per game is a simple starting point, moved up or down for the strength of the opposing defence and for playing at home.
Fair decimal odds are the price at which a bet on that result breaks even over time. A 49.0% chance is fair odds of 2.04.
Probability from 1X2 odds
p = (1 ÷ O) ÷ B [3]
O1, OX and O2 are the decimal odds for a Team A win, a draw and a Team B win. One divided by the odds is the probability a price implies, but a bookmaker’s three prices add up to more than 100%. The extra, B − 1, is the bookmaker margin. Dividing each inverse by B removes it in proportion [3]. Odds of 2.10, 3.40 and 3.60 have a margin of 4.81% and give 45.4%, 28.1% and 26.5%.
Limits of This Estimate
- Treating the two scores as independent tends to predict too few draws, which is why published models add a correction for low-scoring games [1].
- The result is only as good as the expected goals you enter. Injuries, line-ups, red cards and what each team needs from the match are not in the model.
- Removing the margin in proportion tends to rate favourites a little too low and outsiders a little too high [3].
- These are probabilities for the result after normal time. They are not betting advice, and no result is certain.
Sources
- Goddard and Asimakopoulos, Modelling football match results and the efficiency of fixed-odds betting: independent Poisson scores for the two teams, and the shortfall in draws
- National Institute of Standards and Technology, Engineering Statistics Handbook, Poisson Distribution: the Poisson probability formula
- Koning and Zijm, Betting market efficiency and prediction in binary choice models, Annals of Operations Research: removing the bookmaker margin by normalization, and its bias