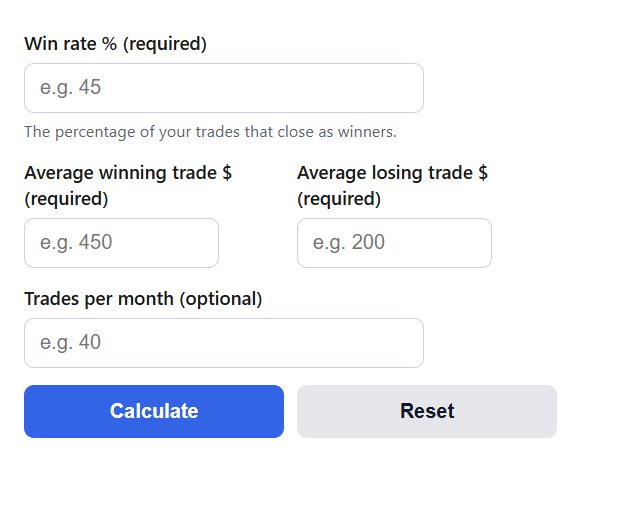
Trade expectancy calculator. Combine win rate, average win, and average loss into expectancy per trade, R-multiple expectancy, and projected monthly P&L.
Trade Expectancy Formula
Expectancy is the average dollar result of one trade, combining how often you win with how much you win and lose:
E = (W * AW) - ((1 - W) * AL)
Dividing by the average loss expresses the same edge in risk units:
E(R) = E / AL
Variables:
- E is the expectancy – the average profit or loss per trade ($)
- W is the win rate as a decimal (0.45 for 45%)
- AW is the average winning trade ($)
- AL is the average losing trade, entered as a positive number ($)
- E(R) is expectancy per unit of risk, where 1R equals the average loss
Enter your win rate and average win and loss from your trading journal – most platforms report all three. The calculator returns expectancy per trade in dollars and in R, the profit factor and win/loss ratio implied by your numbers, the breakeven win rate for your payoff profile, and projected monthly and yearly P&L if you supply a trade count.
Expectancy per $100 Risked
Average result per trade when the average loss is $100, across win rates and win sizes.
| Win rate | Avg win $150 | Avg win $200 | Avg win $300 |
|---|---|---|---|
| 30% | -$25.00 | -$10.00 | $20.00 |
| 40% | $0.00 | $20.00 | $60.00 |
| 50% | $25.00 | $50.00 | $100.00 |
| 60% | $50.00 | $80.00 | $140.00 |
Every diagonal of the table repeats the same lesson: a low win rate is fine if winners are large, and a high win rate is fine if winners are merely equal to losers – but neither excuses the other entirely.
Example Problems
Example 1: A trend-following profile.
Win rate 45%, average win $450, average loss $200.
E = 0.45 * 450 – 0.55 * 200 = 202.50 – 110 = $92.50 per trade, or 92.50 / 200 = 0.46R. Over 40 trades a month that projects to $3,700.
Example 2: A high win rate that still loses.
Win rate 70%, average win $80, average loss $250.
E = 0.70 * 80 – 0.30 * 250 = 56 – 75 = -$19 per trade. Despite winning 7 of 10 trades, the system bleeds money – the classic profile of cutting winners and letting losers run.
Frequently Asked Questions
What is a good expectancy?
Anything reliably positive after costs. Per unit of risk, sustainable systems commonly run 0.1R to 0.5R per trade; claims much above that over large samples deserve skepticism. The dollar figure matters less than the R figure, since position size scales dollars up or down.
How many trades do I need before my expectancy is trustworthy?
Treat numbers from fewer than 50-100 trades as provisional. Small samples overweight streaks, and one outlier win can flip the sign. Recompute on a rolling window so you notice when market conditions change your edge.
How is expectancy different from profit factor?
Profit factor divides gross wins by gross losses (above 1 is profitable); expectancy converts the same information into an average per-trade amount. Expectancy is more actionable because you can multiply it by trade frequency to project P&L over any period.