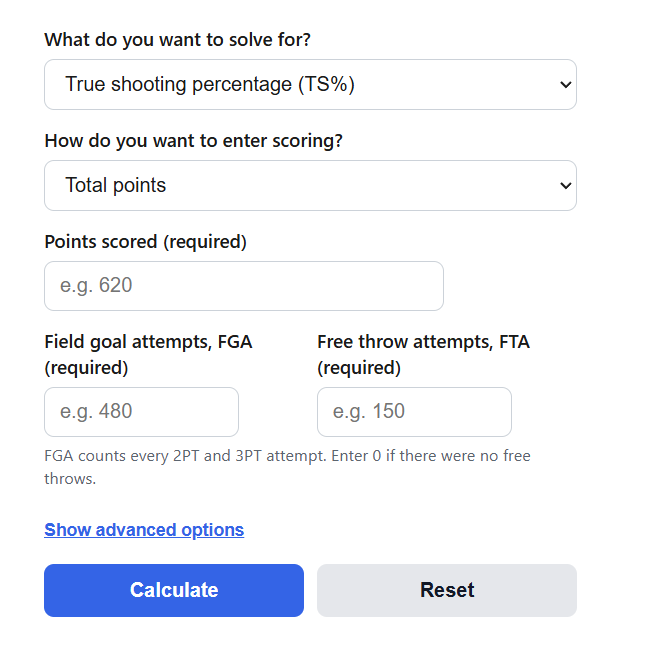
Calculate true shooting percentage (TS%) from points, field goal attempts, and free throw attempts, or find the points needed to hit a target TS%.
True Shooting Percentage Formula
True shooting percentage combines two-point shots, three-point shots, and free throws into a single scoring efficiency number:
TS% = PTS / (2 * (FGA + 0.44 * FTA)) * 100
The calculator can also run the formula backwards to find the points required to reach a target efficiency on a given number of attempts:
PTS = (Target TS% / 100) * 2 * (FGA + 0.44 * FTA)
Variables:
- TS% is the true shooting percentage, expressed as a percent
- PTS is the total points scored, including free throws
- FGA is the total field goal attempts, counting both 2PT and 3PT tries
- FTA is the total free throw attempts
- 0.44 is the free throw weight, an estimate of the share of free throw attempts that end a possession (and-one free throws and technicals do not)
- FGA + 0.44 * FTA is often written as TSA, true shooting attempts
In the default mode you enter points, FGA, and FTA and the tool returns TS% with a rating against NBA benchmarks. If you switch the scoring entry to made shots, you enter 2PT makes, 3PT makes, and free throw makes instead; the calculator totals the points for you and also reports FG%, eFG%, and FT% next to TS% so you can see how much the free throw and three-point adjustments change the picture. The second solve-for mode inverts the formula: give it FGA, FTA, and a target TS%, and it returns the points you would need to score, rounded up to a whole number, along with the maximum points physically possible on those attempts. The advanced options let you swap the 0.44 free throw weight for 0.475, a common estimate in college analytics, or 0.50.
TS% Benchmarks and League Averages by Era
Use this table to read your result. The bands reflect the modern NBA, where the league average sits around 56 to 58 percent.
| TS% range | Rating | What it typically means |
|---|---|---|
| 63% and up | Elite | Top-tier finishers and high-volume rim runners; league-leader territory |
| 60% to 63% | Excellent | All-star level efficiency, especially on high usage |
| 57% to 60% | Above average | Better than the recent NBA norm; a clear efficiency positive |
| 54% to 57% | Around average | Near the historical league norm; acceptable for high-usage creators |
| 50% to 54% | Below average | Inefficient unless paired with heavy playmaking or defense |
| Under 50% | Poor | Scoring costs the team possessions; a red flag at any volume |
Benchmarks move over time, so compare a player to their own era. The second table shows the approximate league-wide TS% in the NBA by period. A 56% season that looks ordinary today would have been clearly above average in the 1990s or 2000s.
| Era | Approximate league TS% | Context |
|---|---|---|
| 1980s | about 54% | Fast pace, few three-point attempts |
| 1990s | about 53% to 54% | Physical defenses, heavy mid-range diets |
| 2000s | about 53% to 54% | Slow pace, isolation-heavy offense |
| 2010 to 2015 | about 54% | Early analytics era, threes rising |
| 2015 to 2019 | about 55% to 56% | Three-point boom reshapes shot selection |
| 2019 to present | about 56% to 58% | Spacing, rim pressure, and free throw efficiency at historic highs |
Example Problems
Example 1: Calculate TS% from a season stat line.
A player scores 620 points on 480 field goal attempts and 150 free throw attempts. First find true shooting attempts:
TSA = 480 + 0.44 * 150 = 480 + 66 = 546
TS% = 620 / (2 * 546) * 100 = 620 / 1092 * 100 = 56.78%
That lands in the around-average band for the modern NBA, and would have been above average in the 1990s.
Example 2: Find the points needed to hit a target TS% in a game.
A player expects about 20 field goal attempts and 8 free throw attempts and wants a 60% true shooting night:
TSA = 20 + 0.44 * 8 = 23.52
PTS = 0.60 * 2 * 23.52 = 28.22, which rounds up to 29 points
Scoring 29 points on that shot volume gives TS% = 29 / 47.04 * 100 = 61.6%, clearing the target.
Frequently Asked Questions
Why does the formula multiply free throw attempts by 0.44?
Not every free throw attempt uses up a possession. And-one free throws, technical free throws, and the first attempts of multi-shot trips come attached to another scoring chance, so counting every FTA as a full possession would overstate a player’s shot load. Across NBA play, roughly 44 percent of free throw attempts end a possession, so the formula weights FTA by 0.44 to approximate true shooting possessions. College analysts often use 0.475 because and-one situations are rarer there, and you can switch to that weight in the advanced options.
What is a good true shooting percentage?
In the modern NBA, the league average is roughly 56 to 58 percent. Anything above 60 percent is excellent, and sustained marks above 63 percent are elite, usually belonging to rim-running centers and the very best high-volume scorers. Below about 50 percent, a player’s scoring is costing the team possessions. Volume and role matter: a 57 percent mark from a primary option facing double teams is more impressive than the same mark from a low-usage lob finisher.
How is TS% different from FG% and eFG%?
Field goal percentage treats every make the same, so a 3-for-9 night from deep (33.3% FG) looks worse than 4-for-9 on twos (44.4% FG) even though both produce similar points. Effective field goal percentage fixes that by giving threes 50 percent extra credit, but it still ignores free throws entirely. TS% accounts for all three ways of scoring, which is why a player who gets to the line often and converts can post a TS% far above their FG%. If you enter made shots in the calculator, it shows all three percentages side by side for the same line.