Calculate the two-tailed Z critical value from a central area or confidence level and get the corresponding Z score for statistics.
Area to Z Score Formula
The following table lists common two-tailed critical z-values for a given central area (confidence level) under the standard normal curve. If A is the central area as a decimal (e.g., 0.95), then the corresponding critical value is z = Φ⁻¹((1 + A)/2), where Φ⁻¹ is the inverse standard normal CDF.
| Central Area / Confidence Level | Z |
| 80% | 1.282 |
| 85% | 1.440 |
| 90% | 1.645 |
| 95% | 1.960 |
| 99% | 2.576 |
| 99.50% | 2.807 |
| 99.90% | 3.291 |
This central area (confidence level) can be represented as a decimal or a percentage. For example, in the table above, 80% would be equal to a decimal amount of 0.80.
This central area is not the same thing as a p-value. In hypothesis testing, a p-value is a tail probability computed from an observed test statistic under a null hypothesis. The values in the tables on this page correspond to two-tailed confidence levels (central coverage between −z and +z).
The selected central area is also related to a confidence interval because a two-sided (1 − α) confidence interval uses the same critical value z = Φ⁻¹(1 − α/2). However, a confidence interval is an interval estimate (lower and upper bounds), not a single percentage, and it is not interchangeable with a p-value.
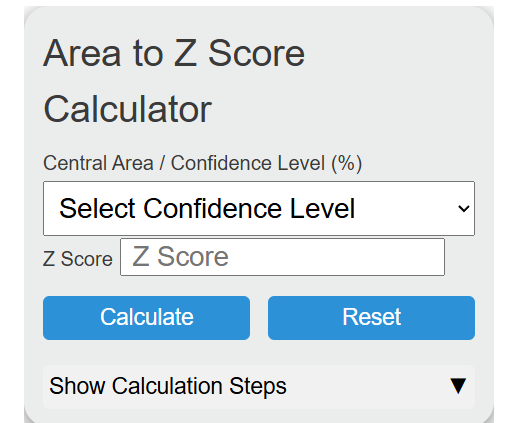
To use the calculator above, select the central area (confidence level) from the drop-down menu, then hit calculate. The calculator will return the corresponding two-tailed critical z-value.
| Central Area / Confidence Level (%) | Z Score |
|---|---|
| 50% | 0.674 |
| 60% | 0.842 |
| 65% | 0.935 |
| 70% | 1.036 |
| 75% | 1.150 |
| 80% | 1.282 |
| 85% | 1.440 |
| 90% | 1.645 |
| 92% | 1.751 |
| 93% | 1.812 |
| 94% | 1.881 |
| 95% | 1.960 |
| 96% | 2.054 |
| 97% | 2.170 |
| 98% | 2.326 |
| 99% | 2.576 |
| 99.5% | 2.807 |
| 99.7% | 2.968 |
| 99.8% | 3.090 |
| 99.9% | 3.291 |
| Two-tailed Z critical values where confidence level = 1 − α and z = Φ⁻¹(1 − α/2). Values rounded to 3 decimals. | |
What is a Z-Score?
A Z-score is a statistical measure that quantifies how far a particular observation or data point is from the mean of a distribution, in terms of standard deviations.
It allows for comparing different data points within a dataset, regardless of the units or scales of measurement. Z-scores are crucial in statistics and data analysis as they provide standardized values that facilitate meaningful comparisons and enable the identification of outliers or extreme observations.
By calculating the Z-score of a data point, we measure how unusual or typical that observation is within its distribution. A positive Z-score indicates that the data point is above the mean, whereas a negative Z-score suggests it is below the mean.
The magnitude of the Z-score reflects how far the data point deviates from the mean, given the standard deviation of the distribution. Consequently, Z-scores allow us to assess whether an observation is relatively high or low compared to others in the dataset.
FAQ
A z-score is the number of standard deviations a value is from the mean of a distribution.
A p-value is the probability, assuming a null hypothesis is true, of observing a test statistic at least as extreme as the one observed (typically a tail probability).