Enter the total time (min) and the total number of responses into the Calculator. The calculator will evaluate the Average Response Time.
- All Business Calculators
- Holding Time Calculator
- AHT (Average Handle Time) Calculator
- Response Rate Calculator
Average Response Time Formula
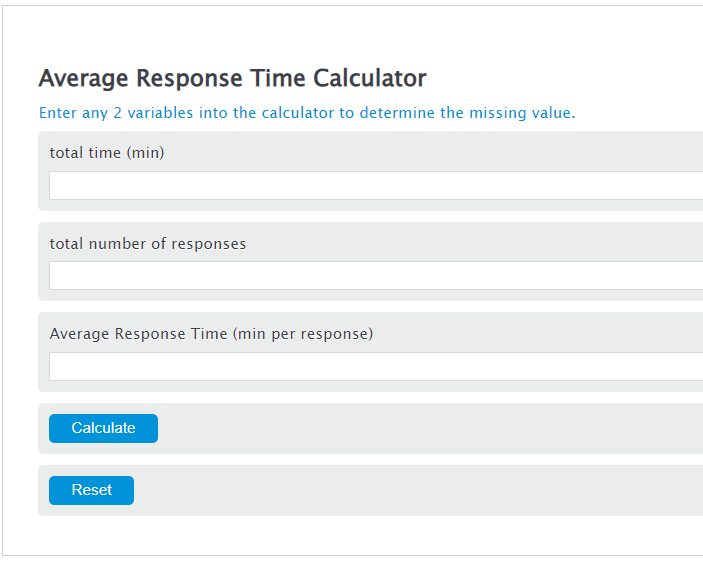
ART = T/R
Variables:
- ART is the Average Response Time (min per response)
- T is the total time spent responding across all interactions (min)
- R is the total number of responses
To calculate Average Response Time, divide the total cumulative time across all responses by the total number of responses. This metric captures every reply delay within a support interaction, not just the first contact.
Weighted Average Response Time
Organizations operating across multiple support channels often need a weighted formula that accounts for varying ticket volumes per channel:
WART = (ART_1 \times n_1 + ART_2 \times n_2 + ... + ART_k \times n_k) / (n_1 + n_2 + ... + n_k)
Where ART_k is the average response time for channel k and n_k is the number of tickets handled through that channel. This prevents a low-volume channel with slow times from disproportionately inflating or deflating the overall metric.
ART vs. First Response Time vs. Resolution Time
Average Response Time (ART), First Response Time (FRT), and Average Resolution Time are three distinct metrics that measure different phases of a support interaction. FRT tracks only the delay between a customer’s initial inquiry and the first human reply. ART captures every reply gap throughout the full conversation. Resolution time measures the total elapsed time from ticket creation to final closure.
FRT tends to correlate more strongly with customer satisfaction scores because it addresses the immediate anxiety of whether anyone will help. Research shows that 89% of customers say a quick initial response influences their purchasing decisions. ART, however, provides a more complete operational picture because a fast first reply followed by days of silence still produces a poor customer experience. Tracking both metrics together reveals whether a team is front-loading speed at the expense of sustained attention.
Response Time Benchmarks by Channel
Response time expectations vary significantly by communication channel. The following benchmarks reflect current industry data:
| Channel | Customer Expectation | Industry Average | Best-in-Class |
|---|---|---|---|
| Live Chat | Immediate (under 1 min) | ~2 min | Under 30 sec |
| Phone | Under 3 min wait | ~5 min | Under 1 min |
| Social Media | Under 1 hour | 4 to 5 hours | Under 30 min |
| Under 24 hours | 12+ hours | Under 4 hours |
These benchmarks shift by industry. SaaS and tech companies typically average 12 to 24 hours for lead response. Real estate operates under 15 to 30 minutes due to high competition. Financial services fall in the 4 to 8 hour range. The key takeaway: a good response time is defined entirely by the channel and sector in which you operate.
Why Percentiles (P50, P95, P99) Are More Useful Than Averages
A simple average can mask serious performance problems. If a support team resolves 99 tickets in 5 minutes each but one ticket takes 8 hours, the average is roughly 10 minutes, which looks acceptable. But that one customer waited 8 hours. Percentile metrics expose this disparity.
P50 (the median) represents the response time that 50% of customers experience or better. P95 captures the experience of the slowest 5% of customers. P99 isolates the worst 1%. For operational monitoring, the gap between P50 and P99 reveals how consistent or erratic your response performance really is. A P50 of 8 minutes with a P99 of 4 hours signals a fundamentally different problem than a P50 of 8 minutes with a P99 of 25 minutes.
To calculate a percentile: sort all response times in ascending order, then find the value at position ceil(percentile x total count). For example, with 200 tickets sorted by response time, the P95 value sits at position ceil(0.95 x 200) = 190. The 190th fastest response time is your P95 threshold.
Measurement Best Practices
Accurate measurement of ART requires several adjustments beyond the raw formula. Automated acknowledgment messages (“We received your request”) should be excluded since they do not represent human engagement. Measuring in business hours rather than calendar hours prevents overnight and weekend gaps from inflating the metric for teams that do not offer 24/7 coverage. Segmenting by agent, team, channel, and time zone isolates specific bottlenecks rather than producing a single number that obscures local performance issues.
Using the median instead of the mean for reporting protects against outlier distortion. A single ticket that sat unassigned for 48 hours can shift a weekly average by 30 minutes or more, while the median remains stable. For executive reporting, present the median alongside P95 to show both typical and worst-case customer experience.
Impact of Response Time on Business Outcomes
Response speed has a measurable financial impact. Studies show that 52% of customers stop purchasing from a business due to slow response times, and 53% abandon a brand over slow email or message replies. In B2B sales, leads contacted within 5 minutes convert at a 32% close rate, which is 2.6 times higher than leads contacted after 24 hours (12% close rate). The average B2B lead response time is 47 hours, and 63% of companies never respond at all, creating an enormous competitive advantage for organizations that prioritize speed.
AI-assisted support is compressing these timelines further. AI chatbots deliver first responses in under one second, and AI-assisted agents handle up to 33% more tickets per hour. However, combined AI and human workflows improve customer satisfaction scores by up to 20% compared to AI-only setups, suggesting that speed without human judgment produces diminishing returns.
FAQ
What is the difference between average response time and first response time?
First Response Time (FRT) measures only the delay between a customer’s initial contact and the first human reply. Average Response Time (ART) includes every reply gap across the entire conversation. FRT correlates more strongly with customer satisfaction, while ART provides a fuller view of ongoing support quality.
What is a good average response time?
It depends on the channel. For live chat, best-in-class teams respond in under 30 seconds. For email, under 4 hours is considered strong. Social media benchmarks target under 30 minutes. Phone support should aim for under 1 minute of hold time. Industry also matters: real estate teams often respond in under 15 minutes, while SaaS companies may average 12 to 24 hours.
Should I use the mean or the median for reporting ART?
The median (P50) is generally more reliable because it resists outlier distortion. A single 48-hour ticket can shift a weekly mean by 30+ minutes while the median remains stable. For the most complete picture, report the median alongside P95 or P99 to capture both typical and worst-case customer experiences.
How does response time affect revenue?
B2B leads contacted within 5 minutes achieve a 32% close rate, 2.6 times higher than leads contacted after 24 hours. On the retention side, 52% of customers stop buying from businesses with slow response times. Reducing ART by even a small margin can produce measurable improvements in conversion and retention rates.
Do automated replies count toward average response time?
No. Automated acknowledgments like “We received your request” should be excluded from ART calculations. Only responses that involve human engagement or substantive AI-generated answers addressing the customer’s specific issue should be counted.
