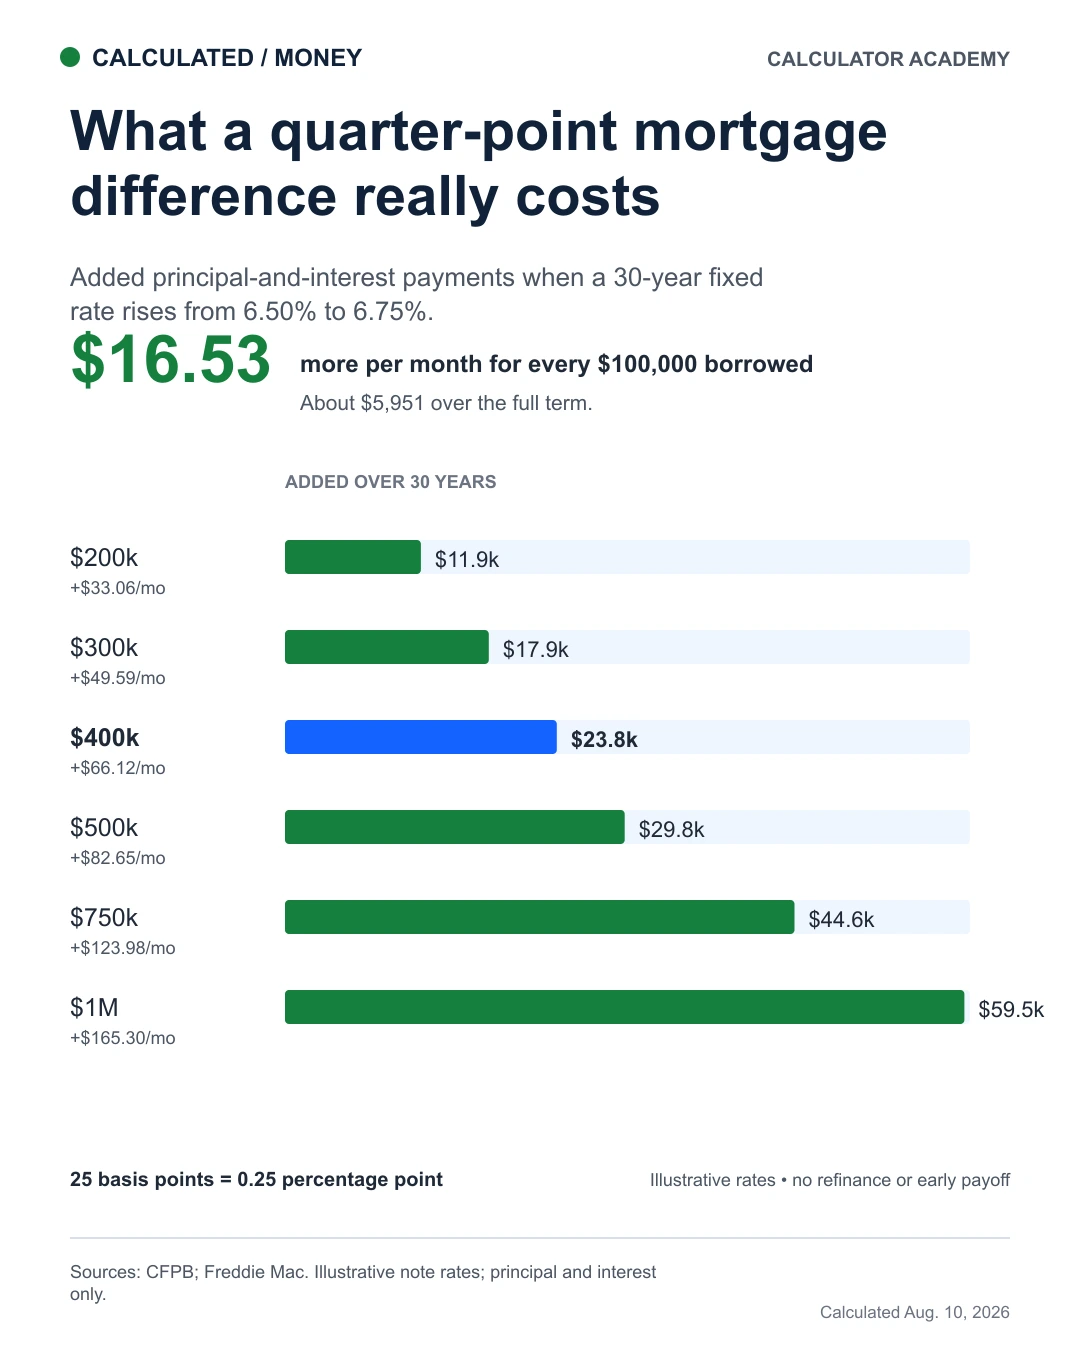
The graphic compares six 30-year fixed mortgage balances at illustrative rates of 6.50% and 6.75%. For $200,000 borrowed, the higher rate adds $33.06 per month and $11,901.65 over 360 scheduled payments. The corresponding figures are $49.59 and $17,852.48 for $300,000; $66.12 and $23,803.31 for $400,000; $82.65 and $29,754.13 for $500,000; $123.98 and $44,631.20 for $750,000; and $165.30 and $59,508.26 for $1 million. Values cover principal and interest only and assume no refinancing, extra payment, sale, or early payoff.
What the numbers show
For every $100,000 borrowed, the higher rate adds about $16.53 per month and $5,950.83 over 30 years.
On a $400,000 mortgage, the difference is $66.12 per month and $23,803.31 over the full term.
On a $1 million mortgage, 25 basis points adds $59,508.26 over 360 scheduled payments.
A small rate change compounds
A quarter of a percentage point can look insignificant beside a six- or seven-percent mortgage rate. Its dollar effect grows with the amount borrowed and the length of the loan.
Using a fully amortizing 30-year fixed mortgage, a $400,000 balance produces a principal-and-interest payment of approximately $2,528.27 at 6.50% and $2,594.39 at 6.75%. That is a difference of $66.12 per month.
For a $400,000, 30-year fixed mortgage, the scheduled principal-and-interest payment rises from $2,528.27 at 6.50% to $2,594.39 at 6.75%—an increase of $66.12 a month. Taxes, insurance, fees, and other housing costs are excluded.
The comparison scales almost exactly with principal because the term and rates remain constant. A $200,000 balance adds approximately $11,902 over the full term, while a $1 million balance adds approximately $59,508.
Holding the illustrative $400,000 mortgage for longer increases the cumulative difference in scheduled payments: about $3,967 after five years, $7,934 after ten, and $23,803 after 360 payments. Actual realized cost can differ if the borrower sells, refinances, prepays, or otherwise ends the loan early.
What is included
The results compare scheduled principal-and-interest payments only. Both scenarios use the same initial balance and 360 monthly payments.
What is not included
The calculation excludes property tax, homeowners insurance, mortgage insurance, HOA charges, points, closing costs, escrow changes, refinancing, extra payments, and early payoff. It compares note rates rather than APRs.
Real borrowers often sell, refinance, or pay additional principal before 30 years. In those cases, the realized difference will differ from the full-term total.
Underlying data
Loan principal ($)
Payment at 6.50% ($/mo)
Payment at 6.75% ($/mo)
Added monthly ($)
Added annual ($)
Added over 30 years ($)
200000
1264.14
1297.20
33.06
396.72
11901.65
300000
1896.20
1945.79
49.59
595.08
17852.48
400000
2528.27
2594.39
66.12
793.44
23803.31
500000
3160.34
3242.99
82.65
991.80
29754.13
750000
4740.51
4864.49
123.98
1487.71
44631.20
1000000
6320.68
6485.98
165.30
1983.61
59508.26
Make the numbers yours
Change the inputs with a related Calculator Academy tool or inspect the underlying data.
The standard fixed-payment formula is M = P(r/12) / [1 - (1 + r/12)^-360], where P is principal and r is the annual note rate as a decimal.
Calculate payments at 6.50% and 6.75% with full precision.
Subtract the unrounded payments.
Multiply the difference by 12 and 360.
Round only the published result.
Because both scenarios repay the same principal, the 30-year payment difference is also the additional interest paid.
Caveats and exclusions
Principal and interest only. Excludes property tax, homeowners insurance, mortgage insurance, HOA charges, points, lender fees, closing costs, escrow changes, refinancing, recasting, extra principal, sale, and early payoff. Uses note rates rather than APRs. Actual lender schedules can differ slightly because of payment rounding and final-payment adjustments.
Government and public guidance pages cited for formula validation. Facts and formula are independently restated; no source artwork is reproduced. Reconfirm current page terms before publication.