Technology
Six tech giants, compared for every $100 of revenue
Latest annual filings put company size on a common denominator: R&D or its disclosed proxy, cash capital expenditure, and net income for every $100 of revenue.
Explore the storyOriginal, sourced visual stories about money, technology, and human performance—with math readers can inspect and tools that make the numbers personal.
Latest annual filings put company size on a common denominator: R&D or its disclosed proxy, cash capital expenditure, and net income for every $100 of revenue.
Explore the storyGross calorie estimates for a 155-pound adult, based on activity classifications in the 2024 Adult Compendium of Physical Activities.
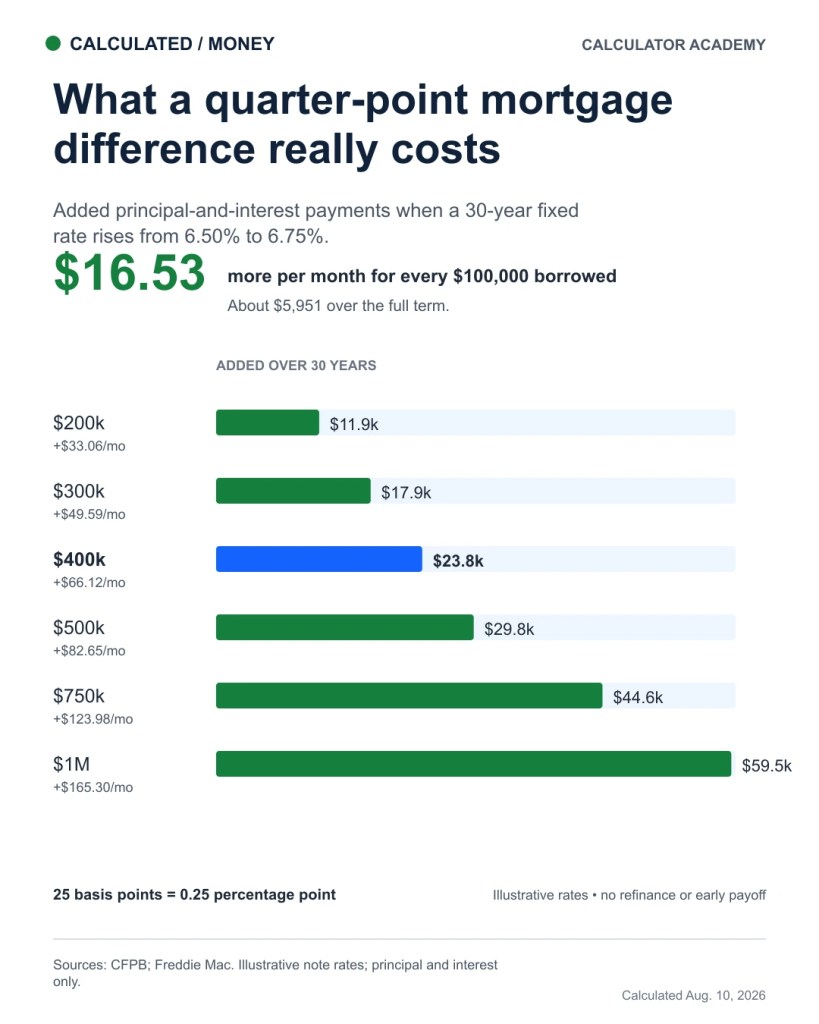
Explore the storyComparing 6.50% with 6.75% shows how a seemingly small mortgage-rate gap adds up across 360 payments and scales with the amount borrowed.
Explore the story