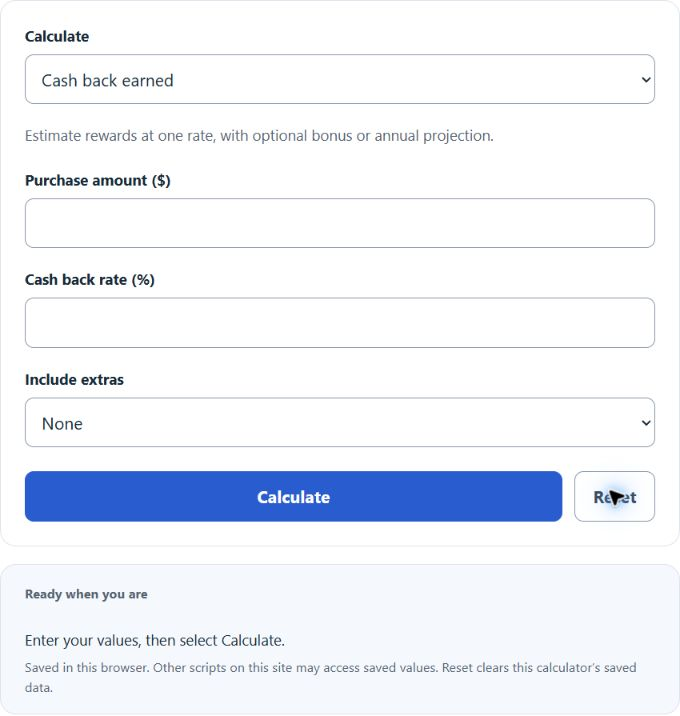
Calculate cash back earned, effective cash back percentage or purchase needed at one rate. Select a one-time bonus or simple annual projection when applicable; this tool does not model category caps or fees.
Cash Back Formula
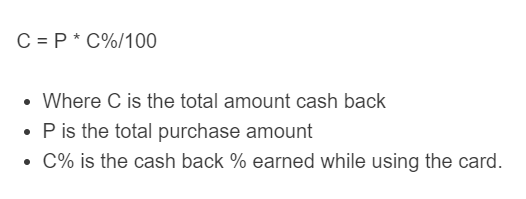
The formula below calculates rate rewards before a flat bonus. Total rewards add a selected one-time bonus; an annual projection uses monthly spending × 12 × rate ÷ 100 and excludes that bonus.
- C = rate reward before a flat bonus ($)
- P = purchase amount ($)
- CP = cash-back rate (%)
Cash Back Reward Structures
Cash back may be redeemed as a statement credit, deposit or other payout under program terms. The following reward structures and numbers are illustrative examples, not current product offers or recommendations:
| Structure | Illustrative Rate | Fee Assumption | Spending Pattern |
|---|---|---|---|
| Flat rate | 1.5% to 2% on all purchases | Example: none | Diverse or unpredictable spending |
| Category-tiered | 3% to 6% on select categories, 1% base | Example: $95 | Concentrated grocery, gas, or dining spend |
| Rotating 5% | 5% quarterly category (cap: $1,500/quarter) | Example: none | Flexible spenders who track categories |
A tiered reward rate depends on eligible spending, category definitions, caps and fallback rates. Compute rewards for each category separately and add them; divide total rewards by total spending in Effective cash back rate mode. For cap calculations, use the related Cash Back Cap Calculator.
Expected Annual Cash Back by Spending Category
The BLS 2024 Consumer Expenditure report, Table 2, reports $78,535 average annual expenditures per consumer unit. The examples below apply hypothetical rates to four survey categories; survey spending is not necessarily eligible card spending.
| Category | BLS 2024 Annual Spend | At Illustrative 2% | Illustrative Category Reward |
|---|---|---|---|
| Groceries (food at home) | $6,224 | $124.48 | $362.24 (capped 6% / 1%)* |
| Dining out (food away from home) | $3,945 | $78.90 | $118.35 (3%) |
| Gasoline and other fuels | $2,645 | $52.90 | $79.35 (3%) |
| Entertainment | $3,609 | $72.18 | $72.18 (2%) |
| 4-category subtotal | $16,423 | $328.46 | $632.12 before fees |
*This hypothetical grocery example uses 6% on the first $6,000 and 1% on the remaining $224: $360 + $2.24 = $362.24. Subtract a $95 annual fee once from the total category rewards to get $537.12 net, before interest or other charges. This calculator uses one uncapped rate; model caps separately.
Annual Fee Break-Even Analysis
For otherwise identical eligible spending and benefits, reward-only break-even spending equals the annual fee difference divided by the difference in earn rates. These illustrative thresholds assume no cap binds and exclude interest, other fees and noncash benefits:
| Comparison | Break-Even Annual Spend |
|---|---|
| $95-fee card at 2% vs. no-fee at 0% | $4,750 |
| $95-fee card at 2% vs. no-fee at 1.5% | $19,000 |
| $95-fee card at 6% grocery vs. no-fee at 3% grocery | $3,167 in grocery spend |
The 6% versus 3% example breaks even at $95 ÷ 0.03 = $3,166.67, below the illustrative $6,000 cap. Above the cap the comparison changes. Use your own qualifying spending and actual program terms; the BLS average does not establish that a fee card is suitable for an individual.
Cash Back vs. Points
Cash back has a stated monetary amount, while point and mile redemption values depend on the program and redemption. Compare the cash value you can actually obtain, after relevant costs and restrictions; no universal cents-per-point value applies.
The CFPB rewards spotlight discusses redemption restrictions and the costs of revolving debt. Fees or interest can exceed rewards; this reward calculator does not determine which card or redemption is best for you.
Tax Treatment of Cash Back
Purchase-based cash back is generally treated as a purchase-price rebate rather than taxable income. An IRS ruling on one purchase-linked reward program supports that treatment for its specific facts and cannot be cited as precedent for every program.
Rewards not tied to purchases, including some signup or referral incentives, may be taxable. Treatment depends on the program and circumstances, and taxable income may require reporting without an information form. Purchase rebates can reduce business expense or asset basis: $2,000 less a $40 rebate gives $1,960 net cost, not necessarily an immediate deduction. See IRS Publication 525 and IRS taxable-income guidance.
FAQ
What is a good cash-back rate?
Compare the effective reward for your qualifying spending after annual fees, interest, caps and redemption restrictions. The illustrative rates in this article are examples, not a ranking of current offers.
Do cash-back rewards expire?
Expiration, forfeiture and redemption rules vary by program. Check the current agreement, including conditions for closing an account or keeping rewards unused.
Is cash back taxable income?
Purchase-based rewards are generally treated as rebates. Some incentives not tied to purchases may be taxable, and business rebates can reduce expense or asset basis. The specific program and circumstances matter; this calculator does not calculate tax.
How do spending caps affect earnings?
Use the bonus rate only on spending within the stated cap, then apply the actual fallback rate above it. For example, $8,000 at 6% on the first $6,000 and 1% afterward earns $380 before fees. This calculator has three single-rate modes; use the related Cash Back Cap Calculator for capped rewards.