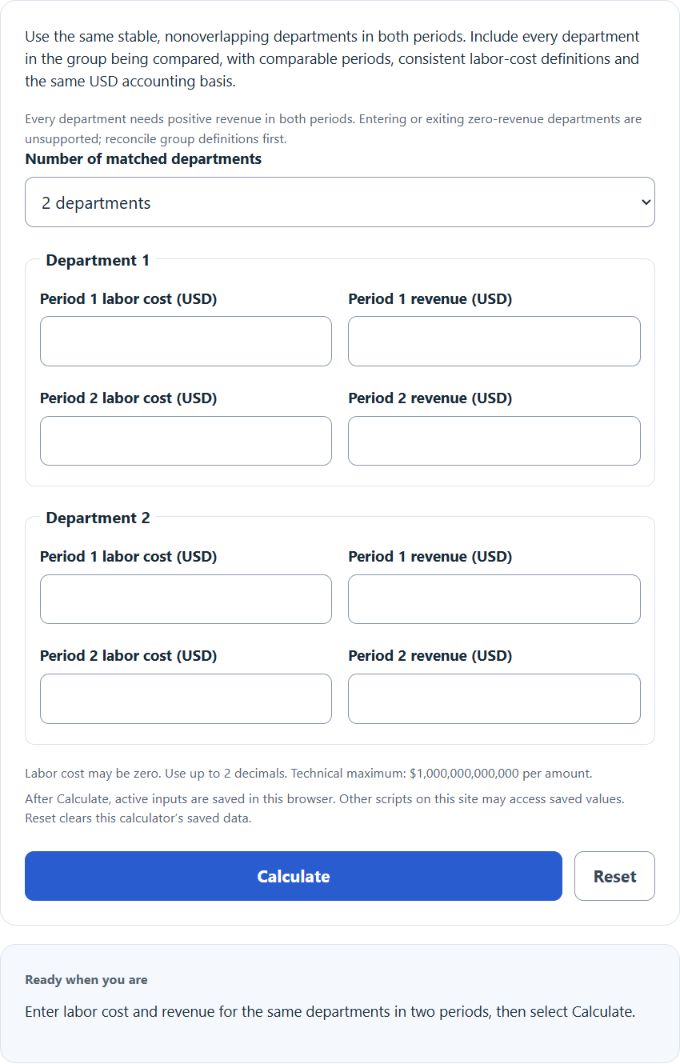
Break a change in overall labor percentage into changes within departments and changes in their share of revenue.
- Labor Percentage Calculator
- Effective Labor Rate Calculator
- Average of Percentages Calculator (Weighted & Simple Mean)
- Cost Income Ratio Calculator
- Business Finance Calculators
- Labor Percentage Change Breakdown Calculator
Department Labor Percentage Mix Formula
For department i in period t:
Labor rate: pi,t = 100 × Li,t ÷ Ri,t
Revenue share: wi,t = Ri,t ÷ ΣRj,t
Within-department contribution = Σ[(wi,0 + wi,1)/2 × (pi,1 − pi,0)]
Revenue-mix contribution = Σ[(pi,0 + pi,1)/2 × (wi,1 − wi,0)]
L is labor cost and R is revenue in USD; 0 and 1 identify the first and second periods. Each revenue share is a fraction, not a percentage. The two contributions are in percentage points (pp) and sum to the change in overall labor percentage, 100 × total labor cost ÷ total revenue.
What the Breakdown Means
The within-department contribution tracks changes in departments’ labor-to-revenue rates. The mix contribution tracks shifts in revenue toward departments with different rates. The method averages both orders of updating the complete rate and revenue-share sets; it does not assume which changed first.
Use 2–10 matched, nonoverlapping departments from the same business in both periods. Results cover only the entered departments; a whole-business comparison requires every department. Keep period length, cost definitions and revenue accounting comparable. Every department needs positive revenue in both periods; labor cost may be zero. Reconcile openings, closures and changed department boundaries before comparing. These are arithmetic contributions, not proof of causes or staffing efficiency.
How to Use the Calculator
- Select the number of departments.
- Enter each department’s labor cost and revenue for both periods, using the same department on each row.
- Select Calculate. Compare the overall change, the two contributions and the department detail table.
Worked Example
Department 1 changes from $16,000 labor on $80,000 revenue to $4,000 on $20,000. Department 2 changes from $8,000 on $20,000 to $32,000 on $80,000. Their labor rates stay at 20% and 40%, respectively.
Overall labor percentage rises from 24% to 36%, a change of +12 pp. The within-department contribution is 0 pp; the revenue-mix contribution is +12 pp. More revenue now comes from the department with the higher labor rate.
FAQ
Why not average the department percentages?
Overall labor percentage weights each department by its revenue share. An unweighted average gives small and large departments equal influence.
Can the contributions offset each other?
Yes. Lower department rates can offset a shift toward departments with higher rates, even when the overall percentage barely changes.
Is this the same as a labor-cost versus revenue breakdown?
No. This calculation separates department rates from revenue shares. A totals-only breakdown compares aggregate labor dollars and aggregate revenue and cannot identify department composition.
Source
Method adapted from Prithwis Das Gupta’s Standardization and Decomposition of Rates: A User’s Manual, U.S. Census Bureau, 1993, sections 4.2 and 5.2. Displays round to four decimals; exact fractions and both update orders appear in Calculation details.