Calculate limit of detection (LOD) from response standard deviation or noise and calibration curve slope using calibration or signal-to-noise methods.
- Percent Deviation Calculator
- Relative Standard Deviation Calculator
- Relative Error Calculator
- All Chemistry Calculators
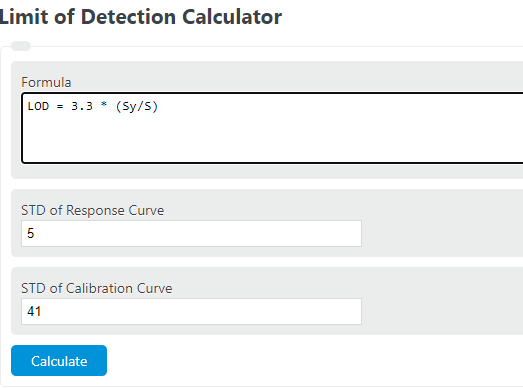
Limit of Detection Formula
The limit of detection (LOD) is the smallest analyte concentration that can be distinguished from background noise by an analytical method. It is a sensitivity metric, not a guarantee of precise quantification. In general, the lower the LOD, the better the method is at detecting trace amounts.
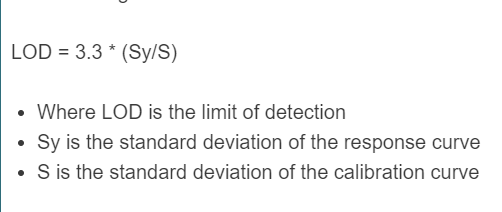
For a calibration-curve approach, the standard expression is:
For a signal-to-noise approach, a common approximation is:
Both forms convert measurement variability in the signal into a concentration threshold. A method with less noise and greater calibration sensitivity will produce a lower LOD.
| Symbol | Meaning | Typical Units | Effect on LOD |
|---|---|---|---|
| LOD | Limit of detection; the minimum detectable concentration | mg/L, µg/L, ng/L, ppm, ppb | The output of the calculation |
| σ | Standard deviation of the response or noise | Signal units such as absorbance, counts, peak area, mAU | Higher σ increases LOD |
| N | Noise standard deviation in a signal-to-noise method | Signal units | Higher noise increases LOD |
| S | Slope of the calibration curve; method sensitivity | Signal per concentration unit | Higher slope decreases LOD |
How to Calculate the Limit of Detection
- Measure the method noise. Determine the standard deviation of the blank response, replicate low-level samples, or residual response around the calibration line, depending on your lab procedure.
- Determine the calibration slope. Fit the calibration curve in its linear region and record the slope. This represents how strongly the instrument responds as concentration changes.
- Keep units consistent. The noise term must be in signal units, and the slope must be in signal per concentration. After division, the result becomes a concentration.
- Apply the formula. Divide the noise term by the slope and multiply by the method factor.
- Report the result with units. LOD should always be stated with the concentration unit used by the calibration.
Why the Formula Works
The ratio of signal variability to calibration slope translates uncertainty in instrument response into uncertainty in concentration. The multiplier used in the LOD equation sets a threshold above the baseline so that the analyte signal is statistically distinguishable from noise. In simple terms:
- More scatter in the signal means the method needs a larger concentration before detection is credible.
- A steeper calibration curve means even small concentrations create noticeable signal changes, lowering the detection limit.
Example Calculation
If the standard deviation of the response is 0.18 signal units and the calibration slope is 0.75 signal units per mg/L, then the LOD is:
This means concentrations below 0.792 mg/L may be too close to baseline variation to claim reliable detection under that method setup.
How to Interpret the Result
- Lower LOD: better sensitivity for trace analysis.
- Higher LOD: more analyte is required before the method can confidently detect it.
- LOD is not the same as accurate quantification: a sample can be detectable but still too low for dependable reporting of its exact concentration.
- LOD is method-specific: changing the instrument, matrix, sample prep, detector settings, or calibration range can change the result.
LOD vs. LOQ
LOD tells you when an analyte becomes detectable. The limit of quantitation (LOQ) is the point where the analyte can usually be measured with more acceptable precision and accuracy.
As a rule, LOQ is higher than LOD because quantifying a concentration reliably requires a stronger signal than simply detecting that something is present.
What Usually Improves LOD
- Reducing baseline noise and drift
- Using cleaner blanks and better sample preparation
- Improving detector stability
- Increasing analytical sensitivity, which raises the calibration slope
- Using a well-behaved linear calibration range with adequate replicate data
Common Mistakes
- Mixing units. If the slope is in signal per µg/L, the resulting LOD will be in µg/L, not mg/L.
- Using the wrong standard deviation. The formula needs variability of the response or noise, not the standard deviation of concentration values.
- Using a poor calibration slope. A slope taken from a nonlinear or poorly fitted calibration curve can distort the LOD.
- Confusing detection with quantitation. LOD indicates presence can be detected; it does not automatically mean the concentration is accurate enough to report with confidence.
- Ignoring matrix effects. A method may have one LOD in a clean standard and a different LOD in a real sample matrix.
FAQ
Is a lower LOD always better?
Usually yes, because it means the method can detect smaller amounts of analyte. However, the LOD still has to be meaningful for the sample type and reporting limits you need.
Why does a steeper slope lower the LOD?
A steeper slope means the signal changes more for the same change in concentration, so the instrument can separate low-level analyte response from noise more easily.
Can the LOD be zero?
No practical analytical method has zero noise, so a true LOD of zero is not realistic.
Why can two labs report different LOD values for the same analyte?
Different instruments, operators, calibration models, sample matrices, and noise conditions all affect the standard deviation term and the calibration slope, which changes the LOD.