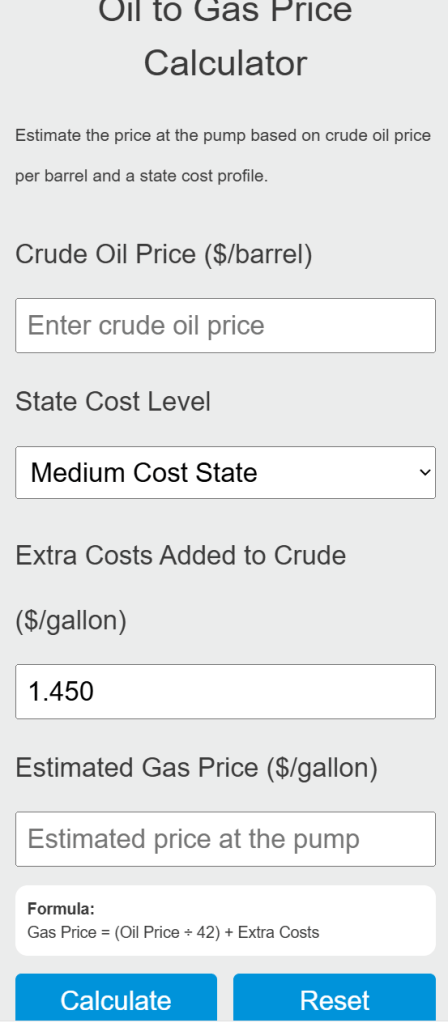
Estimate gas price per gallon from crude oil price per barrel, extra costs, and low, medium, or high state cost profiles.
Related Calculators
- Fuel Price Calculator
- Annual Fuel Cost Calculator
- Cost Per Mile of Driving Calculator
- Miles Per Tank Calculator
- Gallons Per Mile Calculator
- Oil to Gas Ratio Calculator
- All Automotive Calculators
Gas Price From Oil Price Formula
The following formula is used to estimate the gasoline price from crude oil price.
- Where GP is the estimated gasoline price ($/gallon)
- OP is the crude oil price ($/barrel)
- CF is the conversion factor (default 33.69)
When crude oil prices shift by $1 per barrel, retail gasoline prices historically shift by roughly $0.024 per gallon, which is consistent with a divisor near 42 adjusted upward for these added costs.
What Makes Up the Price of Gasoline
Retail gasoline prices are built from four distinct cost layers, each contributing a different share depending on market conditions. According to U.S. Energy Information Administration (EIA) data for 2025, crude oil accounts for approximately 47% of the retail gasoline price, down from 54% in early 2022 and well below the 67% share seen in some prior years. The EIA projects crude oil's share will drop below 45% on an annual average basis in 2026 and 2027 as global supply increases.
Taxes represent the second major component at about 17% of the pump price. The federal excise tax is fixed at $0.184 per gallon. State taxes and fees averaged $0.33 per gallon nationally as of January 2025, but range enormously: Alaska charges just $0.09 per gallon while California charges roughly $0.70. This means fueling in California versus Alaska shifts the per-gallon cost by over $0.60 from taxes alone.
Distribution, marketing, and retail operations make up approximately 36% of the 2025 retail price. This category covers pipeline and truck transport from the refinery to terminals and stations, the retail margin stations charge, and credit card processing fees. Refining costs and profits are embedded in the remaining share, typically ranging from $0.40 to $0.70 per gallon depending on whether summer or winter gasoline blends are being produced.
| Component | Share of Pump Price | Approx. $/Gallon (at $3.00/gal) |
|---|---|---|
| Crude Oil Cost | ~47% | $1.41 |
| Refining Costs & Margin | ~14% | $0.40 - $0.70 |
| Distribution, Marketing & Retail | ~22% | $0.66 |
| Federal Tax | ~6% | $0.184 (fixed) |
| State & Local Taxes | ~11% | $0.09 - $0.70 (varies by state) |
Refinery Yield: What One Barrel Actually Produces
A standard barrel of crude oil contains 42 U.S. gallons, but that barrel does not convert into 42 gallons of gasoline. U.S. refineries produce approximately 19 to 20 gallons of motor gasoline and 11 to 12 gallons of diesel from each 42-gallon barrel. The remaining volume becomes jet fuel, heating oil, liquefied petroleum gases, asphalt, and petrochemical feedstocks.
A phenomenon called processing gain means that the total volume of refined products actually exceeds the input volume. In 2023, U.S. refineries produced an average of about 45 gallons of refined products per 42-gallon barrel of crude oil processed. This happens because many refined products (gasoline, LPG) have lower density than crude oil, so the same mass occupies more volume after refining. This is why the simple calculation of dividing barrel price by 42 would significantly underestimate gasoline's crude cost component: only about 45% of the barrel's volume becomes gasoline, so the crude cost per gallon of gasoline is closer to the barrel price divided by 19 or 20.
The Crack Spread: Measuring Refining Profitability
The crack spread is the difference between the price of refined petroleum products (gasoline and diesel) and the price of crude oil. It represents the gross profit margin a refinery earns from "cracking" crude oil molecules into lighter products. The industry standard metric is the 3:2:1 crack spread, which assumes three barrels of crude oil yield two barrels of gasoline and one barrel of diesel.
In early 2025, gasoline crack spreads at New York Harbor were approximately $0.35 per gallon, roughly $0.08 above the 2020 to 2024 average. Crack spreads are volatile and respond to refinery outages, seasonal demand shifts, and global product trade flows. When crack spreads widen, refiners profit more but consumers pay more at the pump. When they narrow, the opposite occurs. The EIA forecasted that 2025 crack spreads would be wider than 2024 but still narrower than the elevated levels seen in 2022 and 2023.
Why Gas Prices Do Not Always Track Oil Prices
Crude oil and gasoline prices generally move in the same direction, but they diverge frequently and sometimes dramatically. Crude oil prices are more volatile in both directions. During one notable spike, crude oil rose nearly 97% while gasoline rose only about 36%. Several structural factors explain this asymmetry.
Fixed-cost components act as a buffer. Federal and state fuel taxes are set per gallon, not as a percentage, so a $10 per barrel increase in crude translates to roughly a $0.25 per gallon increase in gasoline (the "25-cent rule"), but taxes remain unchanged. At higher pump prices, the fixed tax component becomes a smaller percentage of the total, dampening the percentage move relative to crude.
Seasonal refinery economics also play a role. Summer-blend gasoline costs $0.10 to $0.20 more per gallon to produce than winter-blend because of stricter vapor pressure requirements. Refineries in the Gulf Coast face hurricane risk from June through November, and any disruption to capacity immediately tightens gasoline supply regardless of where crude prices sit. Additionally, U.S. gasoline prices correlate more closely with Brent crude (the global benchmark) than with West Texas Intermediate (WTI), because U.S. refineries increasingly process imported crudes priced off Brent.
State Tax Impact on Pump Prices
State and local fuel taxes create substantial geographic variation in gasoline prices even when crude oil costs are identical nationwide. The table below shows the range across selected states as of January 2025.
| State | State Tax + Fees ($/gallon) | Total w/ Federal ($0.184) |
|---|---|---|
| California (highest) | $0.698 | $0.882 |
| Illinois | $0.661 | $0.845 |
| Pennsylvania | $0.587 | $0.771 |
| New York | $0.456 | $0.640 |
| National Average | $0.330 | $0.514 |
| Texas | $0.200 | $0.384 |
| Mississippi | $0.184 | $0.368 |
| Alaska (lowest) | $0.090 | $0.274 |
A driver filling a 16-gallon tank would pay $9.73 more in total taxes in California than in Alaska. Over a year of weekly fill-ups, that tax differential alone totals roughly $505, illustrating how much state policy influences what consumers actually pay regardless of global crude oil markets.
| Crude Oil ($/barrel) | Est. Gasoline ($/gallon) |
|---|---|
| 40 | 1.19 |
| 50 | 1.48 |
| 60 | 1.78 |
| 70 | 2.08 |
| 80 | 2.37 |
| 90 | 2.67 |
| 100 | 2.97 |
| 110 | 3.27 |
| 120 | 3.56 |
| 130 | 3.86 |
| 140 | 4.16 |
| 150 | 4.45 |
| 175 | 5.19 |
| 200 | 5.94 |
| * Rounded to 2 decimals. Formula: Gasoline ($/gal) = Crude ($/bbl) / 33.69 | |