Find outliers in a dataset with IQR, Z-score, or Grubbs' test and see fences, cutoffs, and flagged values for your numbers quickly.
- All Statistics Calculators
- Z-Score Calculator
- Sampling Error Calculator
- Relative Error Calculator
- Sturges’ Rule Calculator
Outlier Calculator Formulas
The calculator uses three standard methods. Each tab applies the formulas below to the dataset you paste in.
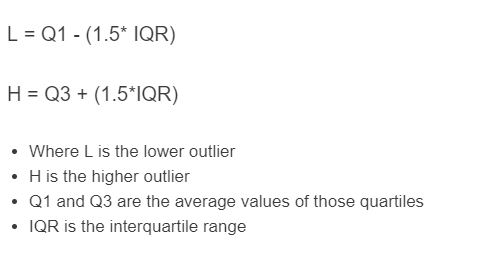
IQR Method
- Q1 = first quartile (25th percentile)
- Q3 = third quartile (75th percentile)
- IQR = interquartile range
- k = fence multiplier, 1.5 for common outliers or 3 for extreme outliers
Any value below the lower fence or above the upper fence is flagged. The exclusive method computes Q1 and Q3 as medians of the lower and upper halves (Tukey/Moore-McCabe). The inclusive method uses linear interpolation on the full sorted array. The two methods can disagree on small datasets.
Z-Score Method
- x_i = each value in the dataset
- mean = arithmetic mean of the data
- SD = sample SD (divide by n-1) or population SD (divide by n)
- Cutoff = absolute Z value above which a point is flagged, typically 3
Any value with |z_i| greater than the cutoff is flagged. Z-scores assume the data is roughly symmetric and not heavily skewed. The mean and SD are themselves pulled by extreme points, so Z-scores can mask outliers in very small samples.
Grubbs' Test
- n = sample size
- SD = sample standard deviation
- alpha = significance level (0.10, 0.05, or 0.01)
- t = critical value from the Student t distribution with n-2 degrees of freedom
The test flags the single most extreme value when G exceeds G_crit. Grubbs' test assumes the underlying data is approximately normal and is designed to detect one outlier at a time. Run it iteratively if you suspect more than one, but expect the critical values to be conservative.
What each calculator function does
- IQR Method tab: sorts your data, computes Q1, Q3, IQR, and the fences, then lists every value outside the fences.
- Z-Score Method tab: computes the mean and chosen SD, returns the Z-score for every point, and marks those past the cutoff.
- Grubbs' Test tab: finds the most extreme point, computes G and G_crit at your chosen alpha, and reports whether the point is statistically significant.
Reference Tables
Use these as quick checks against the calculator output.
When to use each method
| Method | Best for | Avoid when |
|---|---|---|
| IQR (1.5×) | Skewed data, exploratory boxplots | n < 4, or you need a formal test |
| IQR (3×) | Flagging only extreme values | You want sensitivity to mild outliers |
| Z-score | Roughly normal data, n > 30 | Small samples, heavy skew |
| Grubbs' | Normal data, testing one suspected outlier | Multiple outliers, non-normal data |
Grubbs' critical values (two-sided, alpha = 0.05)
| n | G_crit | n | G_crit |
|---|---|---|---|
| 5 | 1.715 | 20 | 2.709 |
| 8 | 2.032 | 25 | 2.822 |
| 10 | 2.176 | 30 | 2.908 |
| 12 | 2.285 | 40 | 3.036 |
| 15 | 2.409 | 50 | 3.128 |
Worked Example and FAQ
Example using the IQR method. Take the dataset 10, 12, 14, 15, 16, 18, 20, 22, 50.
- Sorted, n = 9. Median = 16.
- Lower half: 10, 12, 14, 15. Q1 = (12 + 14) / 2 = 13.
- Upper half: 18, 20, 22, 50. Q3 = (20 + 22) / 2 = 21.
- IQR = 21 - 13 = 8.
- Upper fence = 21 + 1.5 × 8 = 33. Lower fence = 13 - 12 = 1.
- 50 > 33, so 50 is flagged as an outlier.
Why do the IQR and Z-score methods disagree? The Z-score uses the mean and SD, which the outlier itself shifts upward. In small samples, a true outlier can pull the SD high enough that its own Z-score stays under 3. The IQR method uses quartiles, which resist that effect.
Should you delete an outlier? Not automatically. Check for data entry errors first. If the value is real, consider keeping it, using a robust statistic (median, trimmed mean), or reporting results both with and without it.
What sample size do you need? The IQR method works on as few as 4 points but is unstable below about 10. Z-scores need roughly 30 or more for the SD to stabilize. Grubbs' test needs at least 3 but is most reliable from about 7 upward.
Sample SD or population SD? Use sample SD (n-1) when your data is a sample drawn from a larger population, which covers most real cases. Use population SD (n) only when the dataset is the entire population.