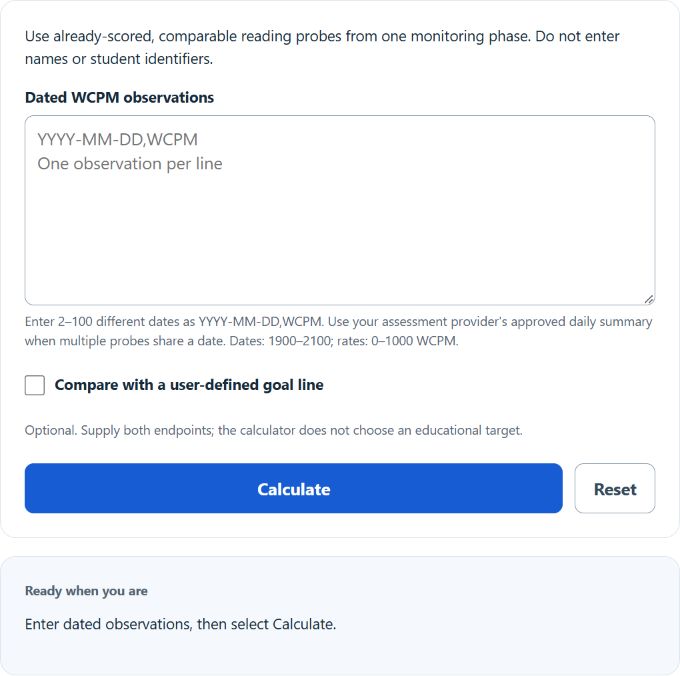
Fit a weekly trend to dated Words Correct Per Minute (WCPM) scores. Compare each observation with an optional goal line you supply.
- WCPM Calculator
- Reading Accuracy Rate Calculator
- Every Day Life And Education Calculators
- Maze Reading Comprehension Score Calculator
- Reading Fluency Percentile Calculator
- Repeated-Reading Error Comparison Calculator
Reading Fluency Progress Formula
The least-squares line uses every score and the actual intervals between dates. One calendar week is seven days, including weekends and breaks.
di is a calendar-day number, d0 the earliest date, xi elapsed weeks, and yi WCPM. n counts distinct dates; bars indicate means. The slope b is WCPM per calendar week and intercept a is WCPM; a + bx is fitted WCPM. Calculations retain full precision; displayed rates generally use two decimals.
Optional Goal Line
Supply baseline and target dates DB, DG and WCPM values YB, YG. The target date must be later. Goal slope g is WCPM per calendar week; G(di) is goal WCPM on the observation date. The gap is observed WCPM minus that value, shown only between the goal endpoints.
How to Use the Calculator
- Enter 2–100 comparable observations from one monitoring phase, one per line as YYYY-MM-DD,WCPM. Uneven intervals and unsorted dates are accepted.
- Enter one approved summary per date. Use your provider’s summary procedure for multiple probes on the same day; omit missed assessments rather than entering zero.
- Optionally enter your goal endpoints, then select Calculate. Open Calculation details for observed, fitted and goal values and signed gaps.
Dates must fall in 1900–2100 and scores in 0–1000 WCPM; these are software limits. Use the same assessment level and collection rules. A different measure or intervention phase may need a separate series.
Worked Example
For these fictional observations:
| Date | Elapsed weeks | WCPM |
|---|---|---|
| 2026-09-01 | 0 | 50 |
| 2026-09-08 | 1 | 52 |
| 2026-09-22 | 3 | 53 |
| 2026-09-29 | 4 | 58 |
Mean week = 2; mean WCPM = 53.25. The centered cross-product sum is 17 and time-square sum is 10, so b = 17 ÷ 10 = 1.70 WCPM/week. The intercept is 49.85; fitted WCPM at week 4 is 56.65.
A supplied goal from 50 WCPM on September 1 to 70 on November 10 spans 10 weeks: g = (70 − 50) ÷ 10 = 2 WCPM/week. Goal values on the four dates are 50, 52, 56 and 58; observed-minus-goal gaps are 0, 0, −3 and 0 WCPM.
FAQ
Is this first-to-last improvement?
No. The fitted slope uses all observations and their dates, so intermediate scores can change it.
Does the trend choose instruction or predict future scores?
No. It describes entered scores, without establishing cause, comprehension, diagnosis or future performance. Two dates define a line but show little variability. NCII trend-line guidance calls for at least eight data points and four weeks of instruction; provider rules may differ. Calendar time does not establish instructional time.
What happens after editing?
The previous result remains labeled until you calculate again. Reset clears this calculator’s fields and saved inputs. Enter dates and scores without names or identifiers.
Sources
- NIST: Least Squares — fitting method and formulas.
- NCII: Academic Progress-Monitoring Decision Rules — interpretation guidance.
- University of Oregon: DIBELS Materials — assessment-specific administration and scoring.