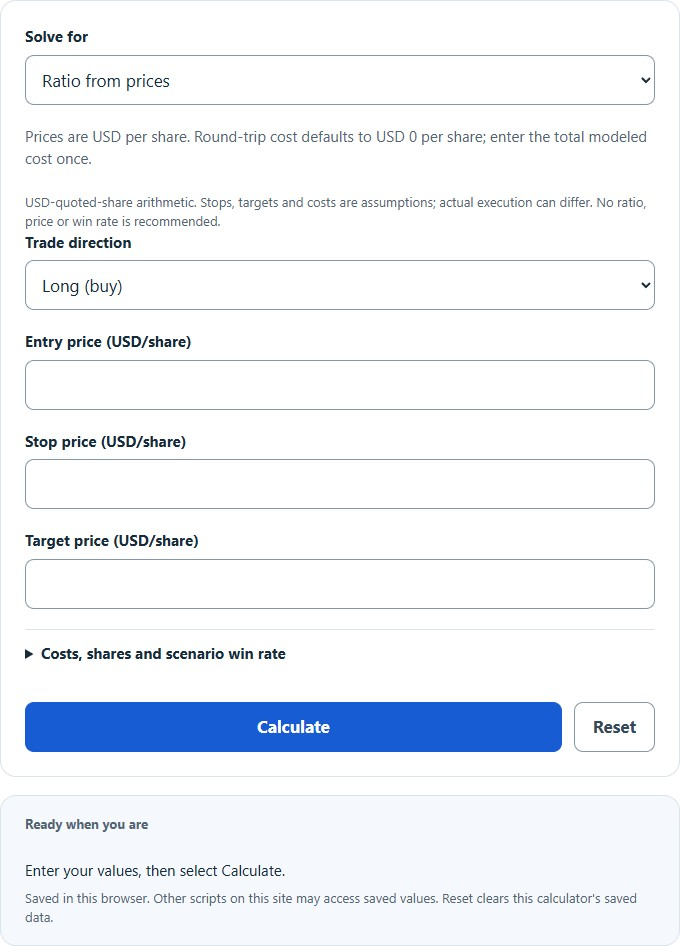
Calculate the risk to reward ratio of a trade from entry, stop loss and target prices, or find the target for a ratio you want, with optional costs.
Risk Reward Ratio Formula
The displayed convention is risk : net reward = 1 : RRR, where RRR means net reward divided by net risk. For a long position, let E be entry, SL the stop, T the target and C the total modeled round-trip cost per share. The cost is applied once to each modeled completed outcome:
RRR = (T - E - C) / (E - SL + C)
For a desired positive net reward-to-risk ratio, the long target equation below includes that same round-trip cost. For a short position, use stop distance SL − E and subtract the required favorable target distance from entry. A computed negative short target is outside this nonnegative share-price model and is rejected, not clamped to zero.
T = E + RRR * (E - SL + C) + C
Variables:
- RRR is the reward-to-risk ratio (2 means the target is twice the risked distance, written 1:2)
- E is the entry price ($)
- SL is the stop loss price ($)
- T is the target (take profit) price ($)
For shorts, gross stop distance is SL − E and gross target distance is E − T. Net stop loss adds C and net target gain subtracts C; the target must leave a positive net gain. All prices and C are USD per share. Optional shares scale net monetary outcomes; a user-supplied scenario win rate enables two-outcome expected P/L. None of these inputs selects a suitable ratio, stop, position or trade.
Breakeven Win Rate by Ratio
The table shows zero-cost examples of W = 1 / (1 + RRR), the break-even threshold in a binary payoff model with a fixed full-target gain and fixed full-stop loss on every trade. At equality expected P/L is zero in that model. Variable outcomes, costs and execution can change actual results.
| Risk : Reward | Breakeven win rate |
|---|---|
| 1 : 0.5 | 66.7% |
| 1 : 1 | 50.0% |
| 1 : 1.5 | 40.0% |
| 1 : 2 | 33.3% |
| 1 : 3 | 25.0% |
| 1 : 5 | 16.7% |
A larger payoff ratio lowers this binary model’s break-even threshold. The ratio alone does not estimate target-hit probability, future win frequency or realized profitability.
Example Problems
Example 1: Find the ratio.
You buy at $50.00, set a stop at $48.00, and target $56.00.
With zero modeled costs: risk = 50 − 48 = $2.00 per share; reward = 56 − 50 = $6.00 per share. RRR = 6 / 2 = 3, displayed risk : reward of 1:3. The binary break-even threshold is 1 / (1 + 3) = 25%, under the stated equal-payoff assumptions.
Example 2: Find the target for a 1:2 trade.
You short at $80.00 with a stop at $82.50 and want a 1:2 ratio.
With zero modeled costs: risk = 82.50 − 80.00 = $2.50 per share. Required reward = 2 × 2.50 = $5.00, so the short target is 80.00 − 5.00 = $75.00. A positive cost changes the target needed for the same net ratio.
Frequently Asked Questions
What is a good risk reward ratio?
No ratio is universally suitable. This calculator compares the prices and modeled costs you enter; it does not choose a ratio or infer a win rate. A positive expected P/L requires separate evidence about actual outcomes and costs, not a price-distance ratio alone.
Does a higher ratio guarantee better results?
No. Stretching a target to force a 1:5 ratio does nothing if price rarely reaches it. Expectancy – win rate multiplied by reward minus loss rate multiplied by risk – is what matters, and it depends on both numbers together.
Where should the stop loss go?
This tool accepts a stop selected outside the calculator and checks its directional relationship to entry. It does not determine appropriate stop placement. Stop orders can execute at a different price, and stop-limit orders can remain unfilled; a modeled stop loss is not a guaranteed maximum realized loss.