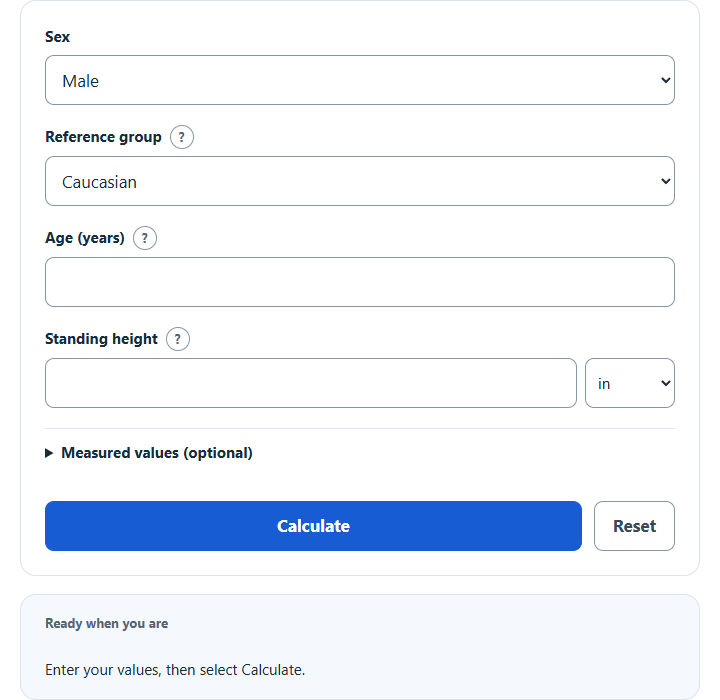
Calculate predicted FEV1, FVC and FEV1/FVC with their lower limits of normal from age, height and sex, and see measured values as percent predicted.
- All Respiratory & Pulmonary Calculators
- PFT Interpretation Calculator
- FEV1/FVC Ratio Calculator
- IRV (Inspiratory Reserve Volume) Calculator
- Respiratory Rate Calculator
- Aerobic Capacity Calculator (VO2 Max Calculator)
Calculator Functions
The calculator gives the FEV1, FVC and FEV1/FVC expected for a healthy nonsmoker of the same age, height, sex and reference group, with the lower limit of normal (LLN) for each. It uses the NHANES III reference equations [1].
| Function | Use it when | You enter |
|---|---|---|
| Predicted values and lower limits of normal | You want the reference FEV1, FVC and FEV1/FVC for a person | Sex, reference group, age and standing height |
| Percent of predicted | You have measured values from a spirometry test | Measured FEV1, measured FVC or both, in liters, under Measured values (optional) |
Height can be entered in inches or centimeters. With measured values, the result also says whether each one is below or at or above its lower limit, and compares the measured FEV1/FVC with its limit when both volumes are entered. To sort a full report into a pattern, use the PFT Interpretation Calculator.
Predicted FEV1 and FVC Formulas
| P | Predicted FEV1 or FVC (L) |
| A | Age (years) |
| H | Standing height (cm) |
| b₀–b₃ | Coefficients for the measure, sex, reference group and age band |
Each sex and reference group has one set of coefficients for younger people and one for adults. The change is at age 20 for males and age 18 for females [1]. For a 40-year-old man who is 69 in (175.26 cm) tall, the Caucasian adult equation gives FEV1 = 0.5536 − 0.01303 × 40 − 0.000172 × 40² + 0.00014098 × 175.26² = 4.09 L. Calculation details under the result show the coefficients used for the person you entered.
Lower limit of normal
b₂A² + b₄H² [1]
The lower limit uses the same equation with a smaller height coefficient, b₄, in place of b₃. It marks the 5th percentile of the reference group: the study set it at the predicted value minus 1.645 standard errors, and the standard error grows with height squared [1]. For the same man, FEV1 LLN = 0.5536 − 0.5212 − 0.2752 + 0.00011607 × 175.26² = 3.32 L.
Predicted FEV1/FVC
R is the predicted FEV1/FVC in percent. It depends on age only and has its own equation, so it is not the predicted FEV1 divided by the predicted FVC. Its lower limit swaps the intercept c₀ for a lower one. For a 40-year-old man in the Caucasian group, R = 88.066 − 0.2066 × 40 = 79.8% and the lower limit is 78.388 − 0.2066 × 40 = 70.1%.
Percent of predicted
M is the measured FEV1 or FVC in liters. A measured FEV1 of 3.3 L against a predicted 4.09 L is 81% of predicted.
Limits of This Estimate
- The equations cover ages 8 to 80 and the three groups in the study: Caucasian, African-American and Mexican-American. They come from 7,429 lifelong nonsmokers without symptoms who were tested in the United States between 1988 and 1994 [1].
- A spirometry report may use a different reference set, so its predicted values and limits can differ from these. When you have a report, its own values are the ones your result was judged against.
- The lower limit is the 5th percentile, so about 1 in 20 healthy nonsmokers falls below it. A value below the limit is a reason to talk to a clinician, not a diagnosis.
- Predicted values step slightly at ages 20 (males) and 18 (females), where the youth equation hands over to the adult one.
Sources
- Hankinson, Odencrantz and Fedan (NIOSH), Spirometric Reference Values from a Sample of the General U.S. Population, American Journal of Respiratory and Critical Care Medicine 159:179–187, 1999: the prediction and lower-limit equations and their coefficients (Tables 4 to 6), the age bands and the study population