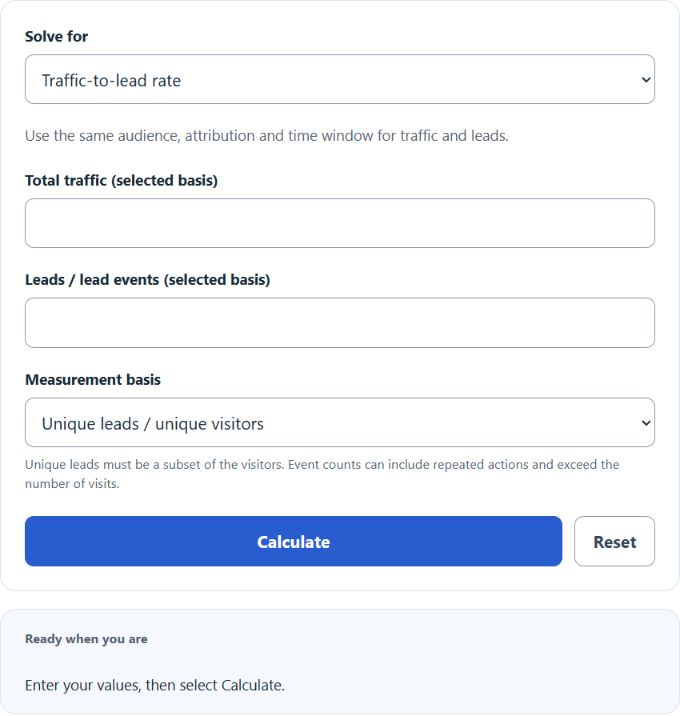
Choose traffic-to-lead rate, expected leads, or traffic needed, then enter the two known values. Select unique visitors and unique leads for a conversion percentage, or repeated lead events for event density.
Related Calculators
- OTS (Opportunity-to-See) Calculator
- Monthly Sales Pace Calculator
- Sales Volume Calculator
- CPT (Cost Per Thousand) Calculator
- All Business Calculators
Traffic To Lead Ratio Formula
With unique visitors and unique leads from the same audience and time window, the traffic-to-lead ratio is a visitor-to-lead conversion percentage. Repeated lead events divided by visits or sessions instead give event density; this can exceed 100 events per 100 traffic units and is not the percentage of people or sessions that converted.
- TLR = traffic to lead ratio, as a percentage
- L = total number of leads
- T = total traffic
To calculate total traffic when you know the number of leads and the ratio, use:
To calculate the total number of leads when you know traffic and the ratio, use:
- Traffic to lead ratio: divide total leads by total traffic, then multiply by 100.
- Total traffic: divide leads by the ratio, then multiply by 100.
- Total number of leads: multiply traffic by the ratio, then divide by 100.
Illustrative Traffic-to-Lead Rate Bands
Performance varies by industry, offer, channel and lead definition. The bands below are illustrative arithmetic ranges, not verified universal benchmarks or quality grades. Compare results with your own consistently measured baseline.
| Traffic to Lead Ratio | General Meaning | What to Check |
|---|---|---|
| Below 1% | Fewer than 1 lead per 100 visitors | Offer fit, landing page clarity, form friction, traffic quality |
| 1% to 3% | 1 to 3 leads per 100 visitors | Calls to action, lead magnet quality, page intent match |
| 3% to 5% | 3 to 5 leads per 100 visitors | Lead quality, follow-up speed, source-level performance |
| Above 5% | More than 5 leads per 100 visitors | Confirm tracking, duplicate leads, and lead qualification rules |
Common Traffic and Lead Outcomes
| Total Traffic | Traffic to Lead Ratio | Expected Leads |
|---|---|---|
| 1,000 | 1% | 10 |
| 1,000 | 2.5% | 25 |
| 5,000 | 2% | 100 |
| 10,000 | 3% | 300 |
Example Calculations
Example 1: Calculate traffic to lead ratio
You had 8,000 visitors and 240 leads.
The traffic to lead ratio is 3%.
Example 2: Calculate total leads
You had 12,000 visitors and a traffic to lead ratio of 2.5%.
The total number of leads is 300.
FAQ
What counts as traffic?
Traffic usually means the total number of visits, sessions, or visitors to a page, website, or campaign. Be consistent with the metric you choose. If you use sessions for traffic, use sessions each time you compare results.
What counts as a lead?
A lead is usually a person who gives contact information or takes a defined conversion action. This can include form submissions, demo requests, quote requests, calls, email signups, or gated content downloads. The ratio changes if your lead definition changes. A unique-visitor conversion rate requires leads to be a subset of those visitors, and is limited to 0–100%. Use the event basis for repeated actions. A rate needs positive traffic; recovering traffic requires a positive rate. Expected lead and traffic counts can be fractional, and forecasts do not guarantee outcomes.
Why is my traffic to lead ratio low?
A low ratio can come from poor traffic quality, weak page intent, unclear calls to action, long forms, slow pages, or an offer that does not match what visitors want. Check performance by traffic source before making changes, because one weak source can lower the overall ratio.