Calculate variance inflation factor from R², or find R² from VIF, to assess multicollinearity in regression models with this calculator.
Related Calculators
- Regression Sample Size Calculator
- AIC Rating Calculator
- Likelihood Ratio Calculator
- T Statistic Calculator (T-Value)
- All Statistics Calculators
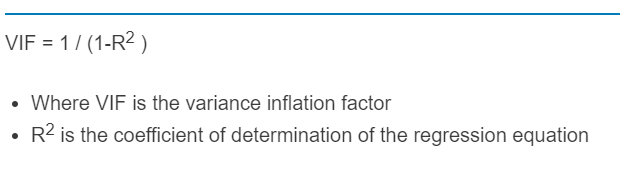
Variance Inflation Factor Formula
The variance inflation factor measures how much the variance of a regression coefficient is increased because one predictor overlaps linearly with the other predictors in a multiple regression model. The calculator uses the auxiliary-regression R-squared for a single predictor to compute its VIF.
- VIF is the variance inflation factor for the selected predictor.
- Auxiliary-regression R-squared is the R-squared obtained by regressing that predictor on all of the other predictors in the model.
Two closely related quantities are tolerance and standard-error inflation:
For a finite result, the auxiliary-regression R-squared must be at least 0 and less than 1. As that value gets closer to 1, the denominator gets smaller and the VIF rises rapidly. If the auxiliary-regression R-squared equals 1 exactly, the predictor is perfectly collinear with the others and does not have a finite VIF.
Variance Inflation Factor Definition
VIF is a diagnostic for multicollinearity. It does not measure overall model quality, and it does not prove that a predictor is unimportant. Instead, it answers a narrower question: how much extra uncertainty is being added to this coefficient because the predictor shares information with the other predictors?
- A low VIF means the predictor contributes relatively distinct information.
- A high VIF means the predictor is highly explained by the other predictors, so its coefficient becomes harder to estimate precisely.
- Large VIF values often lead to wider confidence intervals, less stable p-values, and coefficients that change noticeably when the model specification changes.
- Prediction accuracy can still be acceptable with elevated VIF, but coefficient interpretation becomes less reliable.
How to Calculate Variance Inflation Factor
- Select one predictor from your multiple regression model.
- Run an auxiliary regression where that predictor is treated as the dependent variable and all remaining predictors are used as explanatory variables.
- Record the auxiliary-regression R-squared.
- Enter that value into the calculator to obtain the predictor’s VIF.
- Repeat the process for each predictor if you want a full multicollinearity review of the model.
This is a per-predictor diagnostic. A model with six predictors has six separate VIF values, one for each coefficient.
How to Interpret VIF
VIF should be treated as a guideline rather than a strict pass-fail test. Different disciplines use different cutoffs, and acceptable values depend on sample size, modeling goals, and whether a variable must remain in the model for theoretical or practical reasons.
| VIF Range | Typical Interpretation | What It Usually Means |
|---|---|---|
| 1.0 | No multicollinearity for that predictor | The predictor is not linearly explained by the others. |
| Above 1.0 and below 5.0 | Mild to moderate overlap | Often acceptable, but still worth monitoring if coefficient estimates look unstable. |
| 5.0 to below 10.0 | Meaningful multicollinearity | Interpret coefficients carefully and inspect redundant or highly related predictors. |
| 10.0 or higher | Severe multicollinearity | Coefficient variance is heavily inflated and interpretation can become unreliable. |
Important: some analysts use more conservative thresholds such as 2.5 or 5. The real issue is not the cutoff itself, but whether multicollinearity is distorting coefficient size, sign, confidence intervals, or statistical significance enough to matter for your use case.
Variance Inflation Factor Example
Suppose the auxiliary regression for one predictor produces an R-squared of 0.84.
That result indicates substantial overlap with the other predictors. The coefficient variance for this predictor is 6.25 times larger than it would be with no linear overlap, and its standard error is 2.5 times larger. In practical terms, the variable may still matter, but it will be harder to estimate cleanly and may appear less statistically significant than expected.
What to Do When VIF Is High
- Check for redundant predictors. Multiple variables may be measuring nearly the same concept.
- Combine correlated inputs. Index construction, averaging, or dimension-reduction methods can sometimes preserve information with less redundancy.
- Remove nonessential variables. If two predictors tell almost the same story, keep the one with the clearest interpretation or strongest theoretical justification.
- Center variables when using interactions or polynomial terms. This often reduces nonessential multicollinearity without changing the substantive model.
- Use regularization when prediction is the goal. Penalized methods can handle correlated predictors better than ordinary least squares when interpretability is less important.
- Do not delete a variable automatically. A high VIF is a warning sign, not a command. Context matters.
FAQ
What does VIF stand for?
VIF stands for variance inflation factor.
Can VIF be less than 1?
No. In the standard definition, a finite VIF is always at least 1 because the auxiliary-regression R-squared cannot exceed the valid range used in the calculation.
What does a VIF of 1 mean?
A VIF of 1 means the predictor has no linear association with the other predictors in the model, so its coefficient variance is not inflated by multicollinearity.
Is a high VIF always a reason to remove a variable?
No. A variable may have a high VIF and still be necessary for theory, policy, control, or business logic. The correct response depends on whether the multicollinearity meaningfully harms the precision and interpretability of the coefficient.
What is the difference between VIF and tolerance?
They describe the same issue from opposite directions. VIF grows larger as multicollinearity increases, while tolerance gets smaller.
Does VIF apply to simple linear regression?
With only one predictor, there are no other predictors to regress it on, so the VIF is 1 by definition.
Can interaction terms or polynomial terms create high VIF values?
Yes. Derived terms often correlate strongly with the original variables. In those cases, centering the original inputs can reduce nonessential multicollinearity and make the coefficients easier to interpret.