Calculate Z' factor from positive and negative control means and standard deviations, or find the signal separation needed for a target assay.
- Z-Score Calculator
- Relative Standard Deviation Calculator
- Trimmed Mean Calculator
- All Chemistry Calculators
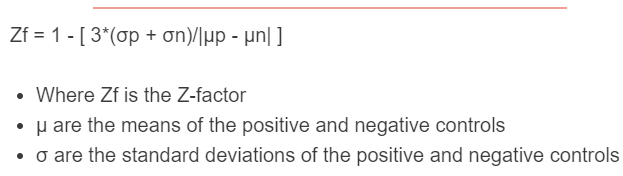
Z Factor Formula
The calculator uses the Z prime (Z') statistic introduced by Zhang, Chung, and Oldenburg (1999) to measure the quality of a high-throughput screening assay based on its controls.
- Z' — Z prime factor (dimensionless)
- μp — mean signal of the positive control
- μn — mean signal of the negative control
- σp — standard deviation of the positive control
- σn — standard deviation of the negative control
In Plan Assay mode, the formula is rearranged to solve for the minimum mean separation needed to hit a target Z':
Z' assumes both controls are approximately normally distributed and that you have enough replicates (typically n ≥ 3, ideally ≥ 8) for stable SD estimates. Z' = 1 is the theoretical maximum (zero variance). Values below 0 mean the control distributions overlap.
Interpreting Z' Values
The Zhang et al. cutoffs are the standard reference for assay quality.
| Z' Value | Quality | Use Case |
|---|---|---|
| 1.0 | Ideal | Theoretical limit (no variance) |
| 0.5 to 1.0 | Excellent | Suitable for HTS campaigns |
| 0.0 to 0.5 | Marginal / doable | Small screens, secondary assays |
| < 0 | Unacceptable | Controls overlap, assay not usable |
Z' versus Z: Z' uses positive and negative controls only. Z (without the prime) substitutes the sample population for the positive control and is used to evaluate a screen run rather than the assay itself.
| Statistic | What It Measures |
|---|---|
| Z' factor | Assay quality from controls only |
| Z factor | Screen performance using sample wells vs. negative control |
| Signal window | (μp − μn) / σn — separation in SD units |
| S/B ratio | μp / μn — gross signal contrast, ignores variance |
Worked Example
You run a kinase assay. Positive control: μp = 15,000, σp = 300. Negative control: μn = 5,000, σn = 300.
- Mean separation: |15,000 − 5,000| = 10,000
- Combined SD: 300 + 300 = 600
- Z' = 1 − (3 × 600) / 10,000 = 1 − 0.18 = 0.82
That falls in the excellent range and is ready for HTS.
FAQ
Why 3 standard deviations? Three SDs covers roughly 99.7% of a normal distribution. The factor enforces a buffer between control distributions so hits are unlikely to be noise.
How many replicates do I need? At least 3 wells per control to compute SD, but 8 to 16 wells per plate is standard for reliable Z' estimates. SD from n = 3 is unstable.
Can Z' be negative? Yes. A negative Z' means 3·(σp + σn) exceeds the mean separation, so the control distributions overlap within the 3-SD window. The assay cannot reliably distinguish hits.
My Z' is 0.4. Can I still screen? For a focused library or secondary assay, yes. For a primary HTS campaign across hundreds of thousands of compounds, no. Optimize the assay first.