Calculate capacity utilization, required capacity, or target output from current output, maximum capacity, production rate, hours, and resources.
- All Business Calculators
- Total Manufacturing Cost Calculator
- Manufacturing Overhead Calculator
- Labor Productivity Calculator
- Cycle Time Calculator
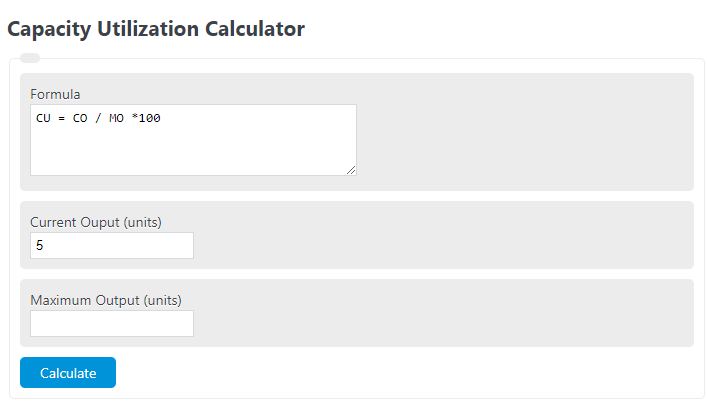
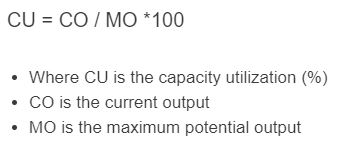
Capacity Utilization Formula
- Actual Output — units produced in the period
- Maximum Capacity — units that could be produced in the same period at full output
If you don’t have a stated maximum capacity, build it from the production rate:
To plan around a target, rearrange the same equation:
Use the same time period for output and capacity. Capacity should reflect realistic maximum output, accounting for planned downtime, shift patterns, and product mix.
Reference Tables
Use these as a starting point. Optimal utilization varies by industry, equipment type, and demand volatility.
| Utilization Range | Interpretation |
|---|---|
| Below 70% | Underused. Fixed costs spread thin; consider demand or capacity reduction. |
| 70% – 84% | Balanced. Room to absorb demand spikes and maintenance. |
| 85% – 94% | High. Watch for bottlenecks and rising overtime. |
| 95% – 100% | Near full. Little buffer for breakdowns or order surges. |
| Above 100% | Overtime, extra shifts, or understated capacity. |
| Sector | Typical Healthy Utilization |
|---|---|
| Total US manufacturing (long-run avg) | 78% – 80% |
| Process industries (chemicals, paper) | 85% – 92% |
| Discrete manufacturing | 75% – 85% |
| Service / call centers | 70% – 85% |
| Hospitals (bed occupancy) | 75% – 85% |
Worked Example
A plant produced 8,200 units last week. Maximum capacity for the week is 10,000 units.
Utilization = (8,200 / 10,000) × 100 = 82%. That falls in the balanced range, with 1,800 units of spare capacity.
To raise utilization to 90%, target output becomes 10,000 × 0.90 = 9,000 units, an increase of 800 units per week.
FAQ
Should I use design capacity or effective capacity? Effective capacity is more useful for operations decisions because it already excludes planned downtime, changeovers, and maintenance. Design capacity will produce lower utilization figures.
Why is utilization above 100%? Either capacity is understated, or production is using overtime, extra shifts, or temporary measures that exceed the stated baseline.
Is higher utilization always better? No. Running above 90% leaves no buffer for breakdowns, demand spikes, or quality recovery. Most operations target 80% to 90% as a sustainable range.
How is this different from OEE? Utilization measures output against capacity. OEE multiplies availability, performance, and quality, so it captures losses inside the running time, not just whether the asset was used.