Calculate cash-back on a single purchase or by spending category, showing total rewards, annual earnings, and net cost after cash-back.
- All Personal Finance Calculators
- Double Discount Calculator
- Daily Interest Rate Calculator
- Stock Calculator
- Cash on Cash Return Calculator
- Unpaid Balance Calculator
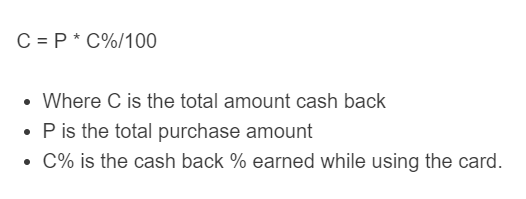
Cash Back Formula
The following formula is used to calculate the cashback earned on a purchase.
- C = total cash back earned ($)
- P = purchase amount ($)
- CP = cash-back rate (%)
Cash Back Reward Structures
Cash back is a rebate paid as a percentage of spending, returned as a statement credit, direct deposit, or check. Three structures dominate the market, each with trade-offs depending on spending patterns:
| Structure | Typical Rate | Annual Fee | Best For |
|---|---|---|---|
| Flat rate | 1.5% to 2% on all purchases | Often none | Diverse or unpredictable spending |
| Category-tiered | 3% to 6% on select categories, 1% base | Sometimes $95+ | Concentrated grocery, gas, or dining spend |
| Rotating 5% | 5% quarterly category (cap: $1,500/quarter) | Sometimes none | Flexible spenders who track categories |
The effective rate on a tiered card depends entirely on spending distribution. If 80% of purchases fall outside bonus categories, the headline rate is misleading. Use the category tab above to calculate your blended effective rate based on actual monthly spending.
Expected Annual Cash Back by Spending Category
The U.S. Bureau of Labor Statistics Consumer Expenditure Survey (2024) places average annual household expenditures at $78,535. Applying common cash-back rates to the highest-volume consumer categories:
| Category | BLS 2024 Annual Spend | At 2% Flat | At Best Category Rate |
|---|---|---|---|
| Groceries (food at home) | $6,228 | $124.56 | $373.68 (6%)* |
| Dining out (food away from home) | $3,948 | $78.96 | $118.44 (3%) |
| Gasoline | ~$3,400 | $68.00 | $102.00 (3%) |
| Entertainment | $3,613 | $72.26 | $72.26 (2%) |
| 4-category subtotal | $17,189 | $344 | $666 |
*The 6% grocery rate applies only to the first $6,000 spent per year and requires a card with a $95 annual fee. Above that cap, the rate drops to 1%.
Annual Fee Break-Even Analysis
A card’s annual fee is justified only when cash-back earnings exceed what a no-fee alternative returns. Break-even spending thresholds:
| Comparison | Break-Even Annual Spend |
|---|---|
| $95-fee card at 2% vs. no-fee at 0% | $4,750 |
| $95-fee card at 2% vs. no-fee at 1.5% | $19,000 |
| $95-fee card at 6% grocery vs. no-fee at 3% grocery | $3,167 in grocery spend |
The average U.S. household spends $6,228 per year on groceries, well above the $3,167 break-even for a premium grocery card. Only spending that earns the fee card’s elevated rate counts toward this calculation. Segment spending by category before comparing cards.
Cash Back vs. Points
Cash back delivers a guaranteed, fixed redemption value: $1 earned equals $1 spent. Points and miles vary. At baseline, most points redeem at 1 cent each, matching cash back. Transferred to airline or hotel partners, points can yield 1.5 to 2.5 cents each, making them 50% to 150% more valuable for travelers who can optimize redemptions.
Bankrate’s 2024 Credit Card Rewards Survey found 61% of rewards cardholders prefer cash back over points or miles. Cash back is the stronger choice when spending is unpredictable, travel is infrequent, or when flexibility to offset any expense is the priority.
Tax Treatment of Cash Back
The IRS classifies cash-back rewards earned through qualifying purchases as a price adjustment (rebate), not income. They are not included in gross income and generally require no reporting from the cardholder.
Three exceptions apply: (1) Sign-up bonuses with no minimum spending requirement may be treated as taxable income, and issuers may issue a 1099-MISC for amounts meeting the reporting threshold. (2) Referral bonuses earned when a friend is approved are generally taxable, as they constitute payment for a service. (3) For business cardholders, cash back reduces the deductible cost basis: a $2,000 equipment purchase earning $40 back is deductible as $1,960, not $2,000.
FAQ
What is a good cash-back rate?
A 2% flat rate is the competitive benchmark for no-annual-fee cards. Category rates above 3% on groceries, dining, or gas are strong. The highest available rates reach 5% to 6% on specific categories, but these typically carry spending caps and sometimes annual fees.
Do cash-back rewards expire?
Most major bank cash-back programs do not expire as long as the account remains open. Some store-branded and co-branded cards limit reward validity to 12 to 24 months. Check your card agreement before leaving rewards unused for extended periods.
Is cash back taxable income?
Generally no. The IRS treats cash back from purchases as a rebate that reduces your purchase price, not as taxable income. Exceptions include sign-up bonuses with no minimum spending requirement and referral bonuses, both potentially taxable. Business cardholders must reduce deductible expenses by the cash-back amount received.
How do spending caps affect earnings?
When a card caps bonus-rate spending at $1,500 per quarter or $6,000 per year, purchases above that threshold earn only the base rate, typically 1%. Spending $8,000 in a category capped at $6,000 earns the premium rate on only $6,000. Use the multi-category tab in this calculator to model your actual blended rate based on spending volume.