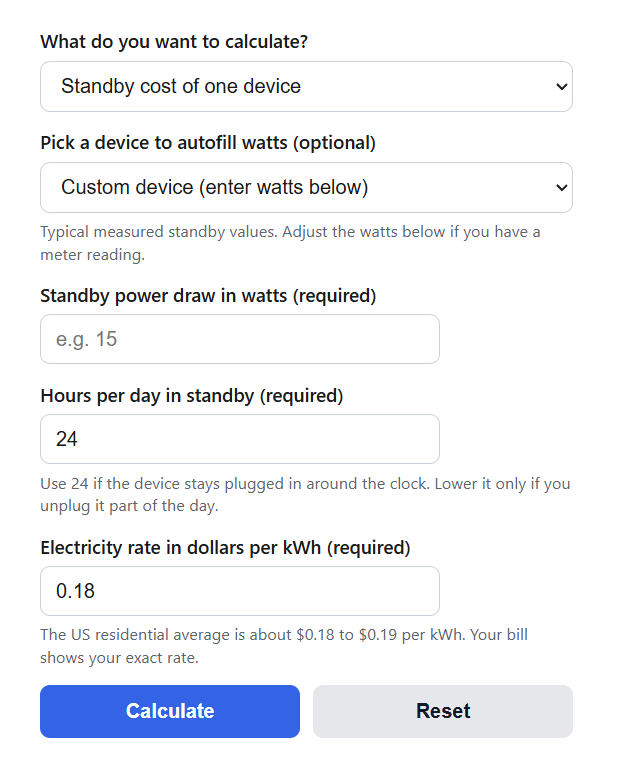
Calculate the yearly cost of standby (phantom) power for one device or your whole home from standby watts and your electricity rate, plus smart plug payback time.
Standby (Phantom) Power Cost Formula
The calculator converts a standby power draw into yearly energy use and multiplies by your electricity rate:
Cost = W/1000 * h * 365 * R
Variables:
- Cost is the yearly standby cost in dollars
- W is the standby power draw in watts
- h is the hours per day the device sits in standby (24 if it is always plugged in)
- R is your electricity rate in dollars per kWh
- W/1000 * h * 365 is the yearly standby energy in kWh
In whole-home mode the calculator applies the same formula at 24 hours per day to a list of devices and sums them:
Total = (W1*Q1 + W2*Q2 + ...)/1000 * 8760 * R
where Q is the quantity of each device and 8760 is the number of hours in a year. The result includes a cost breakdown per device, sorted from most to least expensive, so you can see which loads are worth fixing first.
The smart plug payback mode answers a follow-up question most standby calculators skip: if you buy a smart plug or advanced power strip to kill a phantom load, how long until it pays for itself? A smart plug uses some power of its own, so the calculator nets that out before computing savings:
Payback (months) = 12*P / ((Wcut - Wplug)/1000 * 8760 * R)
where P is the price of the plug or strip, Wcut is the standby load it switches off, and Wplug is the plug’s own draw, typically 0.5 to 2 W for a Wi-Fi smart plug and 0 W for a plain switched strip. The mode also reports net yearly savings and 5-year net savings after the purchase price.
Typical Standby Power Draw and Yearly Cost by Device
Most device labels do not list standby draw, so the table below gives measured typical ranges for common household electronics. The yearly figures use the typical value, 24 hours per day, at the current US average residential rate of about 18 cents per kWh. A useful rule of thumb at that rate: every 1 W left on around the clock costs about $1.58 per year.
| Device | Standby range (W) | Typical (W) | kWh/year | Cost/year at $0.18 |
|---|---|---|---|---|
| Cable or satellite DVR box | 10 to 25 | 15 | 131.4 | $23.65 |
| Game console (rest or instant-on mode) | 2 to 13 | 10 | 87.6 | $15.77 |
| Television with quick-start enabled | 5 to 20 | 10 | 87.6 | $15.77 |
| Wi-Fi router | 5 to 12 | 8 | 70.1 | $12.61 |
| Cable modem | 4 to 10 | 7 | 61.3 | $11.04 |
| Garage door opener (idle) | 3 to 7 | 5 | 43.8 | $7.88 |
| Desktop computer in sleep | 2 to 10 | 5 | 43.8 | $7.88 |
| Printer (idle) | 2 to 8 | 4 | 35.0 | $6.31 |
| Microwave (clock on) | 2 to 4 | 3 | 26.3 | $4.73 |
| Streaming box or stick | 2 to 5 | 3 | 26.3 | $4.73 |
| Smart speaker (idle) | 1.5 to 4 | 2.5 | 21.9 | $3.94 |
| Soundbar or AV receiver (standby) | 1 to 4 | 2 | 17.5 | $3.15 |
| Television with quick-start disabled | 0.5 to 3 | 1 | 8.8 | $1.58 |
| Phone charger (nothing attached) | 0.1 to 0.5 | 0.2 | 1.8 | $0.32 |
Two things stand out. Set-top boxes, consoles in instant-on mode, and networking gear dominate; empty phone chargers, the classic unplugging advice, are nearly irrelevant on modern hardware. And settings often matter more than unplugging: switching a television’s quick-start off or a console from instant-on to energy-saver mode removes most of the load with no wiring changes at all. Across a whole home these loads add up. Smart-meter research on about 70,000 California homes by NRDC found always-on devices consume roughly 1,300 kWh per year in the average home, about 23 percent of total use, which is over $230 per year at the current US average rate.
The payback grid below answers whether a smart plug is worth buying for a given phantom load. It assumes a $15 smart plug that draws 1 W itself, switching the load off 24 hours a day. Find your standby watts in the first column and your electricity rate across the top; the cell shows how long until the plug pays for itself.
| Standby load cut | At $0.12/kWh | At $0.18/kWh | At $0.25/kWh |
|---|---|---|---|
| 5 W | 43 months | 29 months | 21 months |
| 10 W | 19 months | 13 months | 9 months |
| 15 W | 12 months | 8 months | 6 months |
| 25 W (typical entertainment center) | 7 months | 5 months | 3.4 months |
| 40 W | 4.4 months | 3 months | 2.1 months |
Below about 5 W, a smart plug takes years to pay off and a settings change or plain switched strip is the better move. Above about 15 W, payback lands inside a year at almost any US rate.
Standby (Phantom) Power Cost Example Problems
Example 1: A cable DVR box draws 15 W in standby and stays plugged in 24 hours a day. Your rate is $0.18 per kWh. Yearly energy is 15/1000 * 24 * 365 = 131.4 kWh. Yearly cost is 131.4 * 0.18 = $23.65, or about $1.97 per month, roughly 1.3 percent of a typical US home’s 10,500 kWh annual use from a single box.
Example 2: Your entertainment center (TV with quick-start, console in instant-on, soundbar) draws 25 W of combined standby. You buy a $15 smart plug that draws 1 W itself. The net load cut is 25 – 1 = 24 W, which saves 24/1000 * 8760 = 210.2 kWh per year, or $37.84 at $0.18 per kWh. Payback is 12 * 15 / 37.84 = 4.8 months, and 5-year net savings are 37.84 * 5 – 15 = $174.20.
Standby (Phantom) Power Cost Frequently Asked Questions
How do I find the real standby draw of my devices? Product labels list maximum power, not standby power, so the ranges in the table above are the practical starting point. For exact numbers, use a plug-in watt meter (often sold as a kill-a-watt meter) or a smart plug with energy monitoring, and read the draw while the device is off or asleep. Measure anything with a network connection, a clock, a remote control receiver, or a warm power brick, since those are the features that keep drawing power.
Is standby power really 5 to 10 percent of my bill? That widely cited figure from the US Department of Energy and Lawrence Berkeley National Laboratory covers true standby, meaning devices that are off but still energized. Broader always-on idle load, which adds devices left fully on but unused, such as computers that never sleep and always-listening equipment, runs higher: NRDC’s smart-meter analysis put it at about 23 percent of household consumption. Your own share depends mostly on how many set-top boxes, consoles, and always-on computers you run.
Does cutting power to devices cause any harm? Modern electronics store settings in flash memory, so nothing is lost when power is cut. The practical downsides are convenience ones: a DVR may need several minutes to reboot and cannot record while unplugged, a console in energy-saver mode cannot download updates overnight, and a smart speaker stops responding entirely. Cut power to loads you will not miss, and use settings changes for the rest.