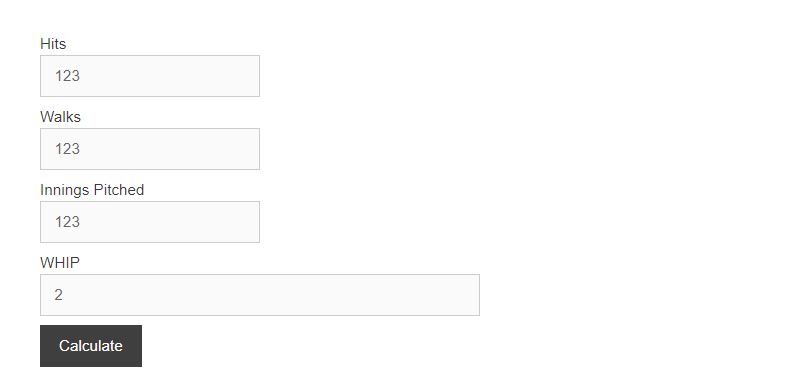
Calculate baseball WHIP from hits, walks, and innings pitched, solve any missing value, and project future WHIP from upcoming innings.
- ERA Calculator
- Fielding Percentage Calculator
- Win Percentage Calculator
- Pitching Velocity Calculator
WHIP Formula
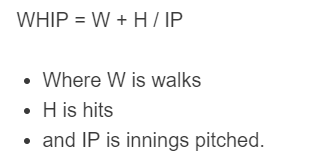
The formula for WHIP is:
Where W is the total walks allowed (both intentional and unintentional), H is total hits allowed (singles, doubles, triples, and home runs all count equally), and IP is innings pitched. When recording partial innings, scorekeepers use decimal notation: 6.1 means 6 and one-third innings, and 6.2 means 6 and two-thirds innings. A pitcher who finishes the 6th inning and records one out in the 7th is listed as 6.1 IP, which equals 6.333 true innings for calculation purposes.
What Is WHIP in Baseball?
WHIP measures the average number of baserunners a pitcher allows per inning, counting only walks and hits. It was invented in 1979 by writer Daniel Okrent, who originally called it “innings pitched ratio.” Okrent deliberately excluded hit-by-pitch from the numerator because Sunday newspapers at the time did not publish hit-batsmen data in their box scores. That exclusion became a permanent feature of the official definition, meaning a pitcher who plunks 10 batters per season earns no WHIP penalty for those baserunners.
Unlike ERA, which measures outcomes (runs scored), WHIP measures the process of preventing baserunners. A pitcher whose fielders let three singles fall in one inning will see his ERA spike while his WHIP rises only modestly. Conversely, a pitcher who allows a lot of baserunners but strand them well (sometimes called “strand rate luck”) will post a lower ERA than his WHIP would predict. This makes WHIP a more pitcher-controlled stat than ERA over short sample sizes, while ERA remains a better measure of actual run prevention over a full season.
WHIP Benchmarks: What Is a Good WHIP?
The MLB league-average WHIP in the modern era typically lands between 1.30 and 1.35 for starting pitchers. The benchmarks below reflect current MLB standards, where strikeout rates are historically high and the league as a whole suppresses batting average compared to earlier eras.
| WHIP Range | Rating | Context |
|---|---|---|
| Below 1.00 | Elite (Cy Young caliber) | Fewer than 1 baserunner per inning; historically rare |
| 1.00 to 1.10 | Excellent | Top 10-15% of starters in any given season |
| 1.10 to 1.25 | Great | Consistent frontline starter territory |
| 1.25 to 1.35 | Above Average / League Average | Solid mid-rotation starter |
| 1.35 to 1.50 | Below Average | Roster-worthy but not reliable in high-leverage spots |
| Above 1.50 | Poor to Replacement Level | Baserunner rate creating significant run-scoring risk |
Relief pitchers operate on different norms. Because closers and high-leverage relievers face only the heart of the opposing order for short stints, elite relievers frequently post WHIPs below 0.90. Mariano Rivera finished his career with a 1.0003 WHIP across 1,283.2 innings, which is remarkable for a 23-year career but actually above the single-season marks of many elite relievers. A relief pitcher with a WHIP above 1.30 is generally considered unreliable in high-stakes situations.
All-Time WHIP Records
The single-season WHIP record belongs to Pedro Martinez of the 2000 Boston Red Sox, who posted a 0.7373 WHIP across 217 innings. That season is widely considered the greatest pitching performance of the live-ball era. Martinez allowed 128 hits and 32 walks over 217 innings while striking out 284 batters. The second-lowest single-season mark belongs to Kenta Maeda of the 2020 Minnesota Twins (0.7500), though that came in the abbreviated 60-game COVID season across only 57.1 innings. The previous full-season record before Martinez was Walter Johnson’s 0.7803 WHIP for the 1913 Washington Senators across 346 innings, a workload that no modern pitcher would approach.
For career WHIP (minimum 1,000 innings pitched), the all-time leader is Addie Joss at 0.9678 across 2,327 innings pitched between 1902 and 1910. Jacob deGrom holds the active career record at approximately 0.9934 through the 2024 season, making him one of only three pitchers in MLB history to finish below 1.00 for a career of that length (alongside Joss and Ed Walsh, who posted 0.9996 across 2,964.1 innings). Walsh’s total is even more impressive given that he pitched from 1904 to 1917 when the “dead ball” era was still ongoing, but the sheer volume of his innings against live competition makes it extraordinary.
| Category | Pitcher | WHIP | Season / Era |
|---|---|---|---|
| Best Single Season (full) | Pedro Martinez | 0.7373 | 2000, Boston Red Sox |
| Best Single Season (short) | Kenta Maeda | 0.7500 | 2020 (57.1 IP), Minnesota Twins |
| Best Career WHIP | Addie Joss | 0.9678 | 1902 to 1910 |
| Best Career (active through 2024) | Jacob deGrom | ~0.9934 | 2014 to present |
| Best Career (modern reliever) | Mariano Rivera | 1.0003 | 1995 to 2013 |
| 2024 MLB Season Leader | Logan Gilbert | 0.89 | 2024, Seattle Mariners |
WHIP vs. ERA vs. FIP
These three stats form the core of modern pitching evaluation and each answers a different question. WHIP asks: how many baserunners is this pitcher allowing per inning? ERA asks: how many earned runs did this pitcher allow per nine innings? FIP (Fielding Independent Pitching) asks: how many runs would this pitcher allow if his team had average defense and average luck on balls in play?
WHIP is stronger than ERA as a short-sample predictor because it is event-based rather than sequence-based. Whether three singles come consecutively (scoring a run) or are spread across three separate innings (scoring nothing) affects ERA dramatically but only marginally affects WHIP. This makes WHIP more stable over small sample sizes, such as a one-month stretch, than ERA. However, WHIP shares a significant flaw with ERA: it includes balls put in play, which research shows are largely outside a pitcher’s control. A hard line drive that a shortstop turns into a double play does not appear in either WHIP or ERA, while a softly hit blooper that falls in adds to both. FIP strips out all balls in play entirely, counting only strikeouts, walks, hit batsmen, and home runs, giving the cleanest picture of what the pitcher himself is controlling. For long-term analysis, FIP is generally preferred. For quick context in fantasy baseball or in-game evaluation, WHIP remains the most accessible and widely used single number.
How Strikeout Rate Shapes WHIP
High strikeout pitchers consistently post lower WHIPs than their walk and hit-rate peers because every strikeout removes the possibility of a ball in play becoming a hit. A pitcher with a 30% strikeout rate is converting roughly 30% of plate appearances into automatic outs, which shrinks the number of at-bats that can produce a hit. Research by FanGraphs found a clear inverse relationship between K% and WHIP: each additional strikeout per nine innings correlates with roughly a 0.03 to 0.05 improvement in WHIP, depending on the walk context.
This is also why WHIP is more sensitive to walks than many analysts initially expect. A walk raises the numerator (W + H) by 1 without adding to innings pitched, and it requires at minimum 4 pitches to deliver, raising pitch count and shortening outings. A hit, by contrast, averages only about 2.5 pitches to produce. From a pure WHIP math standpoint, a walk and a single are identical, but from a pitch efficiency standpoint, walks are more damaging to a pitcher’s ability to stay deep in games. A pitcher who walks 4 batters in a 7-inning outing adds those walks directly to the WHIP numerator while also throwing 16 or more extra pitches, frequently ending their outing earlier and handing the game to the bullpen.
Starters vs. Relief Pitchers: Different WHIP Standards
Starting pitchers and relief pitchers cannot be evaluated on the same WHIP scale. Starters face lineups three or more times per game, and batters improve their performance dramatically on the second and third time through the order. Research shows that hitters post roughly a .020 to .030 higher batting average on the third time through the order versus the first. Relief pitchers, by contrast, almost always face a lineup only once, and elite closers are typically deployed specifically against favorable matchups. This selective use naturally inflates reliever WHIP, meaning a reliever with a 1.20 WHIP is performing below what his role demands, while a starter with a 1.20 WHIP is pitching well.
The rise of the “opener” strategy since 2018, in which a relief pitcher starts the game specifically to face the top of the order before handing off to longer-relief arms, has further complicated WHIP comparisons across roles. Openers frequently pitch only one inning or fewer, producing either very low or very high WHIPs in tiny sample sizes. For analysts and fantasy managers, filtering WHIP by innings pitched threshold (typically 50 or 80 innings for meaningful data) is essential for reliable comparisons.
WHIP in Fantasy Baseball
WHIP is a standard category in rotisserie and head-to-head fantasy baseball leagues, appearing in 4×4, 5×5, and 6×6 formats. Because it rewards both hit-prevention and walk-prevention equally, fantasy managers use WHIP to identify pitchers who may be undervalued by ERA. A pitcher with a 3.80 ERA but a 1.10 WHIP is likely benefiting from strong bullpen protection of inherited runners and may be a better investment than his ERA suggests. Conversely, a pitcher with a 3.20 ERA and a 1.45 WHIP is likely benefiting from good strand-rate luck and represents a regression risk.
For weekly fantasy leagues, WHIP provides an important filter when deciding whether to stream a starting pitcher. A starter with a career WHIP above 1.40 is a high-risk streamer regardless of matchup because he consistently puts runners on base, increasing the probability of a multi-run inning that destroys both WHIP and ERA for that week. Elite streamers typically show a career WHIP below 1.25 with a current-season mark in the same range, indicating consistency rather than a lucky stretch.
Limitations of WHIP
WHIP treats all hits identically: a solo home run adds 1 to the numerator, and so does an infield single. This means a pitcher who allows a lot of home runs but few other hits could post a low WHIP while surrendering far more runs than a pitcher with a slightly higher WHIP and no power-hitting tendencies. In practice, this matters most when evaluating pitchers in launch-angle-era baseball, where many power pitchers allow a disproportionate share of fly balls and home runs relative to their WHIP.
Hit-by-pitch is excluded entirely. A pitcher who hits 15 batters in a season, adding 15 free baserunners, gets no WHIP penalty for those events. This was an original design decision by Okrent in 1979 based on data availability, not analytical intent, and it remains a known gap. Stats like OBA-against (on-base average against), which includes hit-batsmen, provide a more complete picture of baserunner prevention but have not replaced WHIP in mainstream use because of WHIP’s simplicity and historical data comparability across more than a century of baseball records.
Do Intentional Walks Count Against WHIP?
Yes. Both intentional and unintentional walks count equally in WHIP. This is a notable quirk because intentional walks are strategic decisions, often used to set up a force out, avoid a hot hitter, or load the bases for a double-play opportunity. The pitcher does not throw to the strike zone, yet the event adds 1 to the WHIP numerator the same as any unintentional four-pitch walk. For most starting pitchers, intentional walks represent a small portion of total walks (typically 2 to 5 per season), so the impact on WHIP is minor. However, for pitchers on teams with catchers who call for frequent intentional walks, the cumulative effect across a season can add 0.01 to 0.03 to their WHIP, which matters at the margin when competing for roster spots or fantasy rankings.
Should WHIP Be High or Low?
A lower WHIP is always better. A WHIP of 1.00 means the pitcher allows exactly one baserunner per inning on average across hits and walks combined. Over a typical 200-inning season, that translates to 200 baserunners from hits and walks, compared to roughly 260 to 270 for a league-average pitcher. The difference of 60 to 70 fewer baserunners per season has a substantial compounding effect on run prevention, since each additional baserunner increases the probability of that runner eventually scoring. Pitchers who sustain WHIP values below 1.10 over multiple seasons tend to rank among the Cy Young contenders in their respective leagues in those years.
FAQ
WHIP stands for Walks plus Hits per Inning Pitched. It is a baseball pitching metric that measures the average number of baserunners a pitcher allows per inning via walks and hits. A lower WHIP indicates better performance. The MLB league average is approximately 1.30 to 1.35, and any WHIP below 1.00 is considered elite.
WHIP was invented by writer Daniel Okrent in 1979. He originally called it “innings pitched ratio” and excluded hit batsmen because Sunday newspapers at the time did not print that statistic in their box scores. The exclusion became a permanent feature of the official definition.
Pedro Martinez holds the record with a 0.7373 WHIP for the 2000 Boston Red Sox across 217 innings, the lowest full-season mark in MLB history. Walter Johnson held the previous record at 0.7803 for the 1913 Washington Senators.