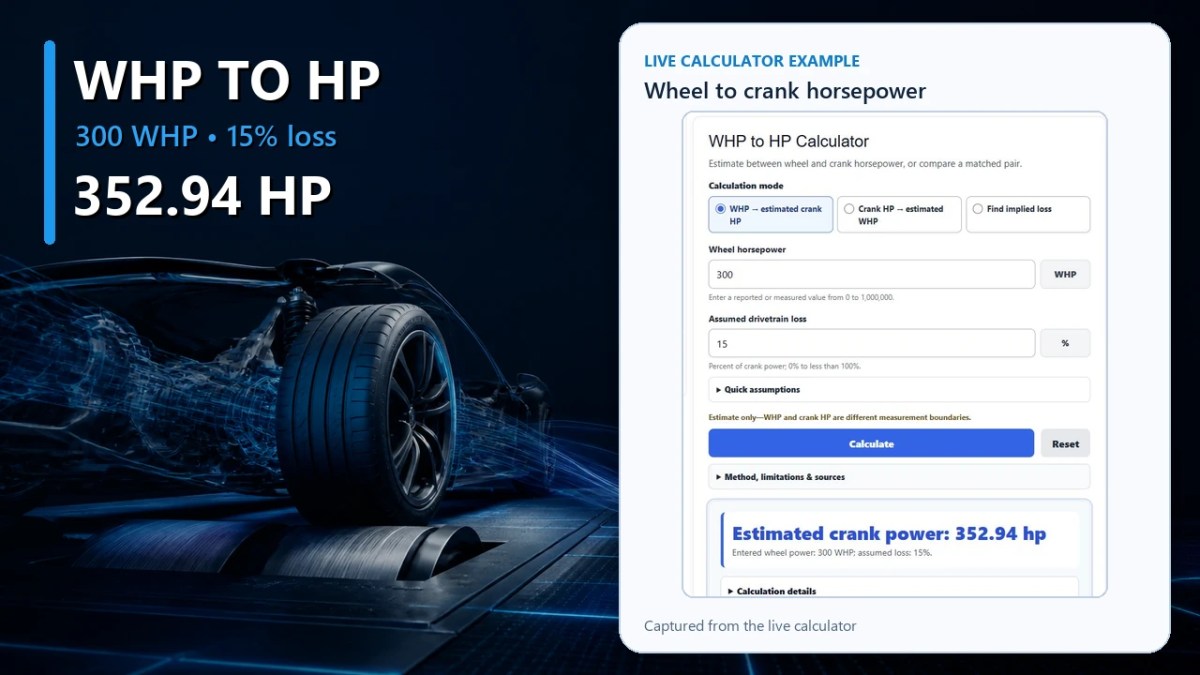
Estimate crank horsepower from WHP, estimate WHP from crank HP, or derive an implied gap from a like-for-like pair. Estimate modes use an editable drivetrain-loss assumption; implied mode derives the percentage from the values you enter.
Watch the full calculation explainer.
How to estimate crank HP from WHP
Direct answer: divide wheel horsepower by the remaining drivetrain efficiency. If loss is defined as a percentage of crank power, the estimate is crank HP = WHP ÷ (1 − loss ÷ 100).
At a 15% assumed loss, 300 WHP corresponds to an estimated 352.94 crank hp. This is a scenario estimate, not a unit conversion or a measured engine rating.
Wheel horsepower and crank horsepower describe power at different measurement boundaries. A chassis or hub dyno reports power through part or all of the installed vehicle drivetrain, while a controlled engine rating is established at the engine output under a defined procedure. No recognized standard found for this review establishes one universal FWD, RWD, AWD, manual, or automatic loss percentage.
WHP to estimated crank HP
Cest = W ÷ (1 − l ÷ 100)W is entered WHP and l is the assumed loss percentage.
Crank HP to estimated WHP
West = C × (1 − l ÷ 100)C is entered crank hp. The same visible assumption is applied in reverse.
Implied loss from a pair
limplied = (1 − W ÷ C) × 100Use only with a meaningfully comparable crank rating and wheel result.
Worked example: 300 WHP at 15% assumed loss
- Remaining efficiency:
1 − 0.15 = 0.85. - Estimated crank power:
300 ÷ 0.85 = 352.941176… hp. - Estimated power difference:
352.941176… − 300 = 52.941176… hp. - Display result: 352.94 crank hp, based on the stated 15% assumption.
WHP to crank HP lookup by assumption
This table is a sensitivity check, not a drivetrain classification. Every column applies the same formula to a different planning assumption.
| Entered WHP | 10% loss | 15% loss | 20% loss | 25% loss |
|---|---|---|---|---|
| 300 WHP | 333.33 hp | 352.94 hp | 375 hp | 400 hp |
| 400 WHP | 444.44 hp | 470.59 hp | 500 hp | 533.33 hp |
| 500 WHP | 555.56 hp | 588.24 hp | 625 hp | 666.67 hp |
| 600 WHP | 666.67 hp | 705.88 hp | 750 hp | 800 hp |
| 1,000 WHP | 1,111.11 hp | 1,176.47 hp | 1,250 hp | 1,333.33 hp |
Crank HP to WHP lookup by assumption
The reverse mode multiplies the entered crank rating by the remaining efficiency. These are estimated wheel values, not promised dyno readings.
| Entered crank HP | 10% loss | 15% loss | 20% loss | 25% loss |
|---|---|---|---|---|
| 300 hp | 270 WHP | 255 WHP | 240 WHP | 225 WHP |
| 400 hp | 360 WHP | 340 WHP | 320 WHP | 300 WHP |
| 500 hp | 450 WHP | 425 WHP | 400 WHP | 375 WHP |
| 600 hp | 540 WHP | 510 WHP | 480 WHP | 450 WHP |
| 1,000 hp | 900 WHP | 850 WHP | 800 WHP | 750 WHP |
WHP, RWHP, BHP, PS, and kW are not interchangeable labels
| Term | Meaning here | Important limit |
|---|---|---|
| WHP | Wheel horsepower reported at a wheel, tire/roller, or hub boundary, depending on the dynamometer. | WHP is not itself a complete test standard. |
| RWHP / FWHP / AWHP | Informal rear-, front-, or all-wheel context for a wheel-power result. | The initials do not establish a loss percentage. |
| Crank HP / flywheel HP | Power at or equivalent to the engine output before the installed vehicle drivetrain. | Accessory state, correction, and rating procedure still matter. |
| BHP | Brake horsepower determined from torque and rotational speed using a dynamometer or brake method; casual usage often means engine power. | The label alone does not identify measurement boundary or test procedure. |
| Mechanical hp | The power unit used by this calculator. | NIST Federal Standard 376B gives 1 mechanical hp as 745.6999 W. |
| kW | A separate SI power unit; 1 mechanical hp equals 0.7456999 kW. | Changing hp to kW converts units. It does not estimate drivetrain loss. |
| PS / CV | Labels commonly used for metric horsepower. | Metric horsepower is not numerically identical to mechanical hp. This calculator does not convert PS or CV. |
| Corrected WHP | A wheel-power result adjusted under a selected atmospheric correction method. | Atmospheric correction does not recover crank power or reveal drivetrain loss. |
How to choose a loss assumption
Use a value documented for the exact vehicle and test context when credible evidence is available. If it is not, treat 10%, 15%, 20%, and 25% as comparison scenarios and report the result together with the selected percentage. Do not choose one number solely from FWD, RWD, AWD, manual, or automatic labels.
A fixed percentage is a compact model. Engineering research on passenger-car transaxles reports that efficiency changes with speed and transmitted load, while other studies identify gear and lubricant temperature as additional variables. The calculator therefore makes the assumption editable and shows sensitivity instead of assigning a drivetrain “standard.”
Why dyno and drivetrain results vary
Measurement boundary and equipment
- Roller and hub systems use different measurement boundaries; inertia and controlled-load modes can also produce noncomparable results.
- Calibration, dyno inertia, parasitic-loss treatment, software settings, and tire/roller contact affect a controlled test.
- Atmospheric correction addresses selected ambient conditions; it does not identify drivetrain loss.
Vehicle and operating condition
- Gear, sweep rate, engine speed, torque, and transmission behavior can change the result.
- Tire pressure, temperature, compound, slip, tie-down load, and wheel inertia matter on roller systems.
- Fluid temperature, heat soak, cooling airflow, fuel, tune, boost control, and vehicle condition affect comparability.
The California Energy Commission report, Appendix C, distinguishes engine and chassis dynamometer measurements. U.S. chassis-dynamometer rules in 40 CFR 1066.210 and 40 CFR 1066.215 require calibration and verification of factors such as force, speed, inertia, parasitic loss, and tire/roll contact in their regulatory context. These regulations are not aftermarket peak-power conversion rules, but they show why setup cannot be ignored.
A repeatability checklist for before-and-after dyno runs
For a modification comparison, the measured WHP change is usually more defensible than converting both runs into crank estimates. Where practical, keep the following consistent:
- same vehicle and dynamometer;
- same correction method, test mode, gear, and sweep or load procedure;
- same tires, tire pressure, roller contact, and tie-down setup;
- similar transmission, differential, engine, intake-air, and charge-air temperatures;
- same fuel, tune, boost strategy, and cooling airflow; and
- multiple repeat runs rather than one isolated peak.
This checklist improves comparability; it does not guarantee identical results or turn chassis WHP into a certified engine rating.
When reverse and implied-loss modes are useful
Crank HP → estimated WHP is useful for planning what an advertised or measured crank figure might look like at the wheel boundary under a stated assumption. It should not be presented as a promised dyno target.
Find implied loss compares entered crank and wheel figures with (1 − WHP ÷ crank HP) × 100. The output is an implied gap, not a direct component-efficiency measurement or a diagnosis. Peaks may occur at different engine speeds or use different accessories, correction methods, and test setups. If WHP exceeds the paired crank rating, the calculator rejects the pair under its nonnegative-loss model and asks the user to check comparability.
EV and hybrid caveat
Do not automatically apply an internal-combustion planning percentage to every hybrid or electric vehicle. Motor count, power electronics, battery limits, control strategy, state of charge, axle blending, and architecture change the rated-system-power problem. SAE J2908_202301 explicitly addresses powertrain-specific variations for electrified vehicle rated power.
Frequently asked questions
Is WHP the same as crank HP?
No. WHP is reported at a wheel, hub, or tire/roller measurement boundary. Crank HP describes engine-output power before the installed vehicle drivetrain. The number and the test procedure both matter.
How do you estimate HP from WHP?
Divide WHP by the remaining efficiency: estimated crank HP = WHP ÷ (1 − loss ÷ 100). Always state the assumed loss with the answer.
What is 300 WHP in crank horsepower?
At a 15% assumed loss, 300 WHP is an estimated 352.94 crank hp. At 10%, 20%, and 25%, the estimates are 333.33, 375, and 400 hp respectively.
What are 400 WHP and 500 WHP in crank horsepower?
At 15% assumed loss, 400 WHP is 470.59 estimated crank hp and 500 WHP is 588.24 estimated crank hp. At 20%, the corresponding estimates are 500 hp and 625 hp.
What drivetrain-loss percentage should I use?
Use a defensible value documented for the same vehicle and test context when available. Otherwise compare several planning assumptions and keep the selected percentage visible. Drive layout alone cannot establish one exact number.
Is BHP exactly the same as crank HP?
Not as a complete technical specification. BHP describes power determined with a brake or dynamometer method and often means engine power in casual use. “Crank hp” identifies a location, while accessories, correction, and rating procedure still need definition.
Why can two dynos show different WHP?
Measurement boundary, calibration, test mode, gear, acceleration rate, tires, tie-down, temperatures, airflow, fuel, tune, software settings, and atmospheric correction can differ. Compare repeat runs under controlled, documented conditions.
Does AWD require one fixed loss percentage?
No. AWD systems differ in hardware, control, torque activity, and compatible dyno setup. “AWHP” gives context for the wheel result but does not create a standardized multiplier.
Methodology and primary sources
Formula and source check: August 10, 2026. The calculator uses full numeric precision for the declared fixed-percent model and rounds only displayed values to at most two decimal places. The algebra is exact for the entered assumption; the assumption is not an empirical measurement. No fixed loss percentage is presented as an SAE, ISO, UNECE, EPA, or NIST standard.
- SAE International, J1349_202511 — scope for as-installed net engine power and torque rating; revised November 19, 2025. It does not prescribe a WHP conversion percentage.
- California Energy Commission, CEC-500-2024-005, Appendix C — engine- versus chassis-dynamometer measurement context, 2024.
- 40 CFR 1066.210 and 40 CFR 1066.215 — U.S. regulatory chassis-dynamometer specifications and verification procedures.
- van Dongen, SAE 820741 and Greenbaum, Kluger, and Westmoreland, SAE 942274 — transmission-efficiency variation with operating conditions.
- SAE International, J2908_202301 — rated-system-power methods and architecture-specific variation for electrified powertrains.
- NIST Federal Standard 376B, §5.2.13 — mechanical horsepower unit definition. This supports hp-to-kW unit conversion, not drivetrain estimation.