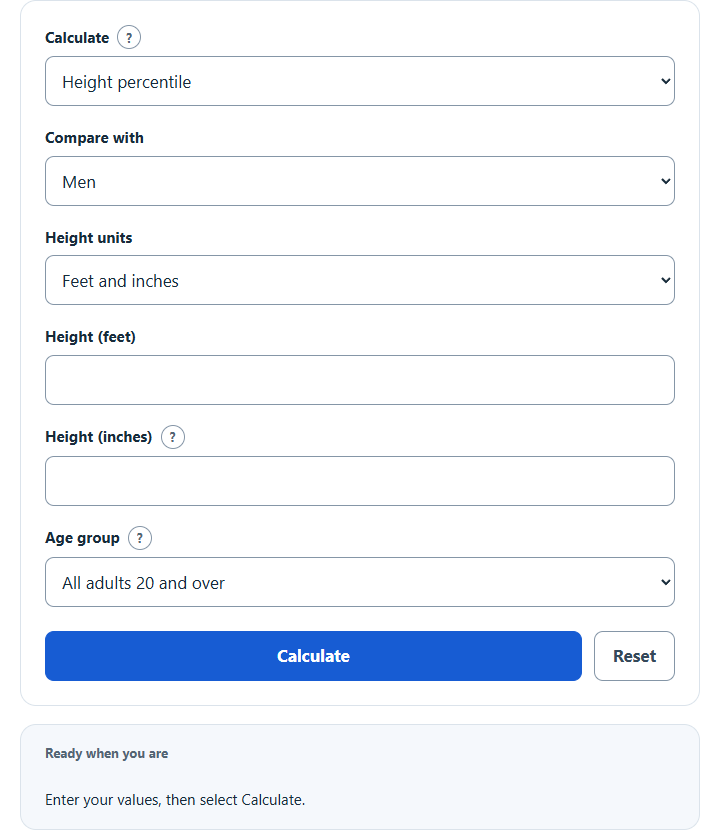
Find what percentage of U.S. men or women are shorter or taller than a given height, or the height at any percentile, from CDC adult measurements.
- All Health Calculators
- Percent of Men Calculator
- Child Growth Percentile Calculator
- Leg to Body Ratio Calculator
- Height to Weight Ratio Calculator
- Sitting Height Calculator
- Spirometry Predicted Values Calculator
Calculator Functions
The calculator compares an adult height with measured U.S. adults: it gives the percentile, the share of men or women who are shorter or at least as tall, and how rare that height is. It can also work backward from a percentile to a height. Select a function to open it in the calculator.
| Function | Use it when | You enter |
|---|---|---|
| Height percentile | You want to know what percentage of men or women are shorter or taller than a height | Height in feet and inches or centimeters |
| Height at a percentile | You want the height of, say, the tallest 10% of men | Percentile |
Both functions compare with men or women, and with all adults aged 20 and over or one age group from 20–29 to 80 and over. Leaving inches blank counts as 0.
Height Percentile Formulas
| z | Your height's position on the standard normal curve, read from CDC's percentile heights below |
| Φ | Cumulative distribution function of the standard normal curve: the share of values below z |
| P | Your percentile: the share of adults in the chosen group who are shorter than you (%) |
CDC publishes the height at the 5th, 10th, 15th, 25th, 50th, 75th, 85th, 90th and 95th percentiles for each sex and age group [1]. Each of those percentiles has a fixed z value, such as 1.2816 for the 90th. The calculator finds the two published heights on either side of yours and reads z between them:
r = (zi+1 − zi) ÷ (hi+1 − hi)
Here h is your height in centimeters, hi and hi+1 are the published heights just below and above it, and zi and zi+1 are their z values, so r is how fast z rises per centimeter between them.
Height at a percentile
This runs the same steps in reverse. The percentile becomes z through the inverse of Φ, the normal percent point function [2], and the height is read between the two published heights around that z.
Very short or very tall heights
σ = (h95 − h5) ÷ 3.2897
Above the 95th percentile height, the calculator extends the curve as a normal distribution whose spread σ matches the gap between the published 5th and 95th percentiles. Below the 5th percentile it does the same from h5, starting at z = −1.6449. For U.S. men aged 20 and over, σ = (187.4 − 162.8) ÷ 3.2897 = 7.48 cm.
U.S. Adult Height Percentiles
These are the measured heights the calculator uses for adults aged 20 and over [1]. A man 6 ft 1 in tall is at about the 92nd percentile, so roughly 1 in 12 men are taller.
| Percentile | Men | Women |
|---|---|---|
| 5th | 5 ft 4.1 in (162.8 cm) | 4 ft 11 in (149.8 cm) |
| 10th | 5 ft 5.3 in (165.8 cm) | 5 ft 0 in (152.5 cm) |
| 25th | 5 ft 7 in (170.1 cm) | 5 ft 1.6 in (156.4 cm) |
| 50th | 5 ft 9.1 in (175.4 cm) | 5 ft 3.5 in (161.3 cm) |
| 75th | 5 ft 10.9 in (180.2 cm) | 5 ft 5.4 in (166.0 cm) |
| 90th | 6 ft 0.7 in (184.7 cm) | 5 ft 7 in (170.2 cm) |
| 95th | 6 ft 1.8 in (187.4 cm) | 5 ft 7.9 in (172.5 cm) |
Limits of This Estimate
- The comparison is with U.S. adults whose standing height was measured on a wall-mounted stadiometer in 2015–2018 [1]. A height measured in shoes reads high, and adults in other countries have different height distributions.
- Between the 5th and 95th percentiles the result follows CDC's published heights. Beyond them it assumes a normal curve, so results for very short or very tall people are approximate.
- The groups include all races and Hispanic origins. CDC also reports heights for each group separately, and their percentiles differ [1].
Sources
- National Center for Health Statistics, Anthropometric Reference Data for Children and Adults: United States, 2015–2018 (Vital and Health Statistics, Series 3, No. 46): adult standing height percentiles by sex and age (Tables 9 and 11) and how height was measured
- NIST/SEMATECH e-Handbook of Statistical Methods, Normal Distribution: the normal cumulative distribution function and percent point function