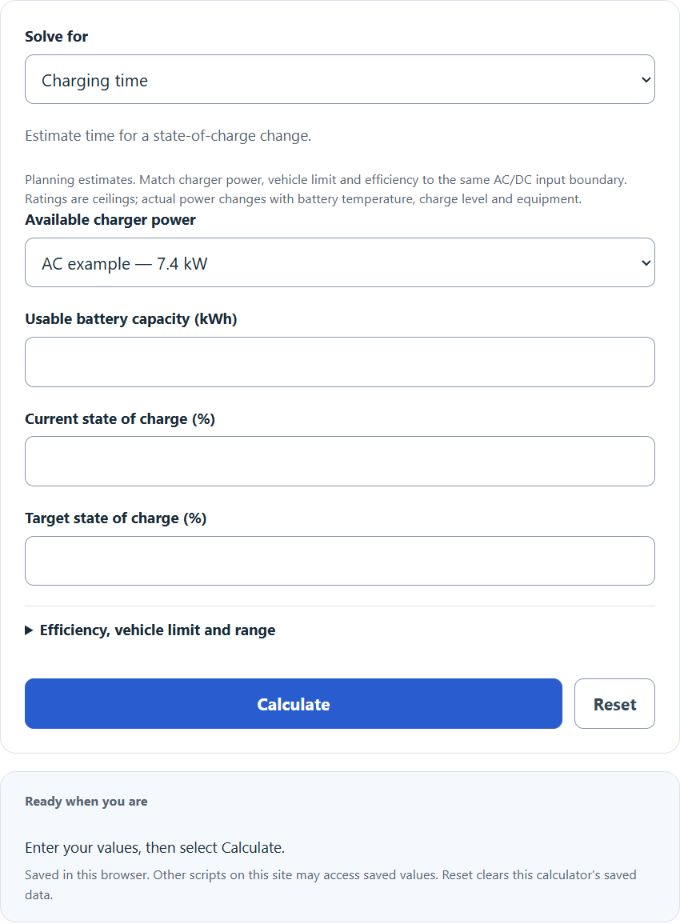
Calculate how long it takes to charge an EV from battery capacity, charge level, and charger power, covering Level 1, Level 2, and DC fast charging.
EV Charging Time Formula
T = (C * (SOCt - SOCc) / 100) / (P * eff)
- T is the charging time in hours
- C is the usable battery capacity in kilowatt-hours (kWh)
- SOCt is the target state of charge in percent
- SOCc is the current state of charge in percent
- P is the charger power in kilowatts (kW)
- eff is the explicitly assumed input-to-battery efficiency as a decimal. Blank uses illustrative 0.90 AC or 0.93 DC; time-window mode uses 0.90.
Time mode applies this constant-power formula with an optional matching vehicle input limit. Efficiency is measured from the selected input boundary to stored battery energy. For DC, the optional stepped scenario assumes full rate below 80%, half from 80–90%, and quarter from 90–100%. These factors are hypothetical and do not represent a universal or vehicle-specific charging curve. Constant power is selected initially.
The second mode solves the same relationship for power instead of time:
P = (C * (SOCt - SOCc) / 100) / (T * eff)
Enter an available duration in hours or minutes to estimate the required constant average input power. This does not prove that a particular charger or vehicle can meet the window, determine an AC/DC equipment class, or provide installation advice. The blank efficiency assumption in this mode is explicitly 90%.
Illustrative Charging Power Scenarios
The following illustrative constant-power scenarios assume 75 kWh usable capacity, a 20–80% change, no lower vehicle limit, 90% input-to-battery efficiency for AC examples and 93% for DC examples. Range rates use 3 battery-side mi/kWh. These are rounded arithmetic examples, not measured charging sessions.
| Charger | Power | Range added per hour | 20-80% time (75 kWh) |
|---|---|---|---|
| Level 1 (120V outlet) | 1.4 kW | 3 to 4 mi | about 36 hours |
| Level 2 (16A) | 3.7 kW | about 10 mi | 13h 31m |
| Level 2 (32A) | 7.4 kW | about 20 mi | 6h 46m |
| Level 2 (48A) | 11.5 kW | about 31 mi | 4h 21m |
| Level 2 (80A) | 19.2 kW | about 52 mi | 2h 36m |
| DC fast | 50 kW | 139.5 mi | 58m |
| DC fast | 150 kW | 418.5 mi | 19m |
| DC fast | 250 kW | 697.5 mi | 12m |
Charging losses and auxiliary use depend on equipment, conditions and the measurement boundary. The following ranges are illustrative efficiency assumptions, not verified performance bands for weather or charger types. Input energy is 45 kWh divided by the assumed efficiency; for DC, that input boundary need not be the wall meter.
| Scenario | Assumed efficiency | Input energy to add 45 kWh |
|---|---|---|
| Assumption A | 93% to 95% | 47 to 48 kWh |
| Assumption B | 88% to 92% | 49 to 51 kWh |
| Assumption C | 80% to 88% | 51 to 56 kWh |
| Assumption D | 75% to 85% | 53 to 60 kWh |
Use a supported input-to-battery efficiency for the power boundary you enter. The blank defaults of 90% AC and 93% DC are illustrative only. Temperature and auxiliary loads can affect actual timing and losses; no fixed winter efficiency correction is asserted.
Example Problems
Example 1: With 75 kWh usable capacity, 20–80% SOC, 7.4 kW constant input and an assumed 90% efficiency, the battery needs 45 kWh. Battery power is 6.66 kW, so time is 45 / 6.66 = 6.7568 hours, about 6 hours 46 minutes. Input energy is 50 kWh. A lower vehicle limit or varying power changes this estimate.
Example 2: A 60 kWh usable battery changing from 10% to 80% needs 42 kWh. In 5 hours the required average battery power is 8.4 kW, or 9.3333 kW input at an assumed 90% efficiency. This arithmetic does not guarantee that a 9.6 kW charger and the vehicle can sustain the required rate.
Frequently Asked Questions
Why do DC fast chargers slow down after 80%?
Battery management limits charging power to operate within cell and temperature constraints. Charging generally slows as the battery fills, especially near a high state of charge. The exact curve depends on the vehicle and conditions; the optional half/quarter-rate scenario is illustrative, not a prediction.
Why is my actual charging time longer than the calculated time?
Temperature, battery management, vehicle AC/DC limits, power sharing and charging interruptions can change actual timing. Enter the applicable vehicle input limit and a supported efficiency assumption. For a realistic DC session, use vehicle-specific measured charging information rather than assuming a rated peak lasts for the full session.
Should I enter total or usable battery capacity?
Use the capacity corresponding to the vehicle’s displayed usable state-of-charge window. Total pack capacity and manufacturer buffers may use different definitions. SOC is treated as proportional to usable energy here, so the result remains an estimate.