Calculate tensile strength, ultimate force, or cross-sectional area from any two values, or find minimum round bar diameter with safety factor.
- All Construction Calculators
- Yield Strength Calculator
- Bending Stress Calculator
- Factor of Safety Calculator
- Punching Force Calculator
- Compressive Strength Calculator
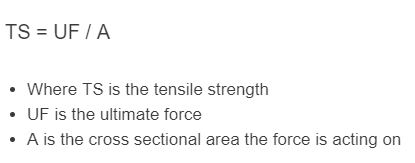
Tensile Strength Formula
The following formula is used to calculate tensile strength:
- Where TS is the tensile strength (Pa or psi)
- F is the maximum force applied at failure (N or lbf)
- A is the original cross-sectional area of the specimen (m² or in²)
This formula uses the original cross-sectional area of the test specimen, not the reduced area at the point of fracture. That distinction is important: using the original area gives what engineers call “engineering stress,” while using the instantaneous area at each moment of deformation gives “true stress.” Engineering stress is the standard reported value because it corresponds to the dimensions a designer actually specifies.
For the design tab, the calculator also uses the allowable stress formula: Allowable Stress = Tensile Strength / Factor of Safety. The required cross-sectional area is then A = F / Allowable Stress, and for a round bar the minimum diameter is d = sqrt(4A / pi).
What Is Tensile Strength
Tensile strength, formally called ultimate tensile strength (UTS), is the maximum stress a material can sustain under uniaxial tension before it fractures. It is the single most referenced mechanical property in material datasheets because it sets an absolute ceiling on the load a given cross-section can carry.
When a tensile test specimen is pulled in a universal testing machine, the load increases through the elastic region, passes the yield point, continues rising through the strain-hardening region, reaches a peak (the UTS), and then drops as the specimen necks down until fracture. The UTS is that peak value divided by the original area. Most ductile metals show clear necking after UTS, while brittle materials like cast iron or ceramics fracture at or very near the UTS with almost no visible necking.
Yield Strength vs. Ultimate Tensile Strength vs. Breaking Strength
These three values each describe a different point on the stress-strain curve and serve different roles in engineering design:
Yield strength is the stress at which a material begins to deform permanently. Below this value, the material returns to its original shape when the load is removed. For steels this is often identified by a distinct “yield point” on the curve. For aluminum and many other non-ferrous alloys, there is no sharp yield point, so engineers use a 0.2% offset method, drawing a line parallel to the elastic region offset by 0.2% strain and reading where it intersects the curve.
Ultimate tensile strength (UTS) is the peak stress on the engineering stress-strain curve. It represents the maximum load the specimen can carry before necking localizes. Structural codes typically apply a factor of safety to either the yield or UTS (or both) when setting allowable design stresses.
Breaking (fracture) strength is the stress at which the specimen physically separates. For ductile materials the breaking strength is lower than UTS because the cross-section has necked down significantly. For brittle materials the breaking strength and UTS are nearly identical because fracture happens suddenly.
Tensile Strength of Common Engineering Materials
The table below lists typical ultimate tensile strength values for widely used engineering materials. These are representative values; actual strength depends on alloy grade, temper, heat treatment, and manufacturing process. The “Specific Strength” column (UTS divided by density) shows how efficiently a material carries tensile load relative to its weight, which is a critical factor in aerospace and automotive lightweighting.
| Material | UTS (MPa) | UTS (ksi) | Density (g/cm3) | Specific Strength (kN-m/kg) |
|---|---|---|---|---|
| Low-carbon steel (AISI 1018) | 440 | 64 | 7.87 | 56 |
| Medium-carbon steel (AISI 1045) | 585 | 85 | 7.87 | 74 |
| Stainless steel 304 | 515 | 75 | 8.00 | 64 |
| Stainless steel 17-4 PH (H900) | 1310 | 190 | 7.78 | 168 |
| Tool steel (AISI D2) | 1850 | 268 | 7.70 | 240 |
| Aluminum 6061-T6 | 310 | 45 | 2.70 | 115 |
| Aluminum 7075-T6 | 572 | 83 | 2.81 | 204 |
| Titanium Ti-6Al-4V | 950 | 138 | 4.43 | 214 |
| Copper C11000 (pure) | 220 | 32 | 8.96 | 25 |
| Brass C36000 | 490 | 71 | 8.50 | 58 |
| Inconel 718 | 1240 | 180 | 8.19 | 151 |
| Gray cast iron (Class 40) | 293 | 42 | 7.15 | 41 |
| Nylon 6/6 | 85 | 12 | 1.14 | 75 |
| Polycarbonate | 65 | 9.4 | 1.20 | 54 |
| CFRP (unidirectional) | 1500 | 218 | 1.60 | 938 |
| E-Glass fiber (strand) | 3450 | 500 | 2.54 | 1358 |
| Kevlar 49 fiber | 3620 | 525 | 1.44 | 2514 |
| Spider silk (dragline) | 1000 | 145 | 1.30 | 769 |
Several patterns emerge from this data. Fiber materials dominate specific strength because they carry load almost entirely along their axis with very low density. Kevlar 49 fiber achieves a specific strength of roughly 2,514 kN-m/kg, about 45 times higher than low-carbon steel. Titanium Ti-6Al-4V and aluminum 7075-T6 both offer more than double the specific strength of mild steel, which explains their prevalence in aerospace structures where every kilogram of weight reduction translates to fuel savings over the life of an aircraft.
The Stress-Strain Curve and Where UTS Sits
A standard tensile test produces a stress-strain curve that reveals far more than just the UTS. Understanding the full shape of this curve is essential for anyone selecting materials or sizing structural members.
The curve begins with the elastic region, a straight line whose slope is the modulus of elasticity (Young’s modulus). In this zone, deformation is fully reversible. Steel has a Young’s modulus of about 200 GPa, aluminum about 69 GPa, and titanium about 114 GPa. A steeper slope means the material is stiffer and deflects less under the same stress.
At the yield point, the curve bends over and the material begins to deform plastically. Low-carbon steels often show an upper and lower yield point with a small load drop (the Luders band phenomenon), while most other alloys transition smoothly. The region between yield and UTS is the strain-hardening region. Here, dislocation density increases within the crystal lattice, making each successive increment of deformation require more stress.
At UTS, the load peaks. In ductile materials, a localized reduction in cross-section called necking begins. The engineering stress drops because the load decreases faster than the area shrinks (when measured against the original area). The true stress actually continues to increase in the neck until fracture. The specimen finally separates at the fracture point.
The total area under the stress-strain curve up to fracture represents the material’s toughness, the total energy per unit volume the material can absorb before breaking. A material can have high UTS but low toughness if it fractures with very little strain (like a hard ceramic), or moderate UTS with high toughness if it stretches significantly before breaking (like annealed copper).
Factors That Affect Tensile Strength
Tensile strength is not a fixed property of a chemical composition alone. It is highly sensitive to processing history, environmental conditions, and microstructure. The major influencing factors include:
Temperature
Most metals lose tensile strength as temperature rises because thermal energy makes it easier for dislocations to move through the crystal lattice. Mild steel at 400 degrees C retains only about 60% to 70% of its room-temperature UTS. At cryogenic temperatures the opposite trend appears for many face-centered cubic (FCC) metals like austenitic stainless steels, which actually get stronger and remain ductile. Body-centered cubic (BCC) steels, however, become brittle at low temperatures, a phenomenon that contributed to the Liberty ship hull failures during World War II.
Grain Size
Smaller grains produce higher strength. Grain boundaries act as barriers to dislocation motion, so more boundaries mean more resistance to plastic deformation. This relationship is quantified by the Hall-Petch equation: yield stress increases proportionally to the inverse square root of the average grain diameter. A steel with a grain size of 10 micrometers will have a meaningfully higher yield and tensile strength than the same composition with a 100-micrometer grain size. Processes like thermomechanical controlled rolling and rapid cooling are used specifically to refine grain size in structural steels.
Strain Rate
Faster loading rates generally increase measured tensile strength. At quasi-static rates (around 0.001 per second, the standard testing speed), the material has time for dislocation rearrangement. At high strain rates (above 1,000 per second, as in impact or blast loading), there is insufficient time for thermal activation to assist dislocation motion, so the material resists deformation more strongly. This effect is more pronounced in BCC metals than FCC metals and is especially significant in polymers, where a factor of two increase in UTS between static and impact rates is common.
Heat Treatment and Cold Working
Heat treatment can dramatically change tensile strength without altering chemical composition. Quenching and tempering a medium-carbon steel like AISI 4140 can raise its UTS from about 655 MPa in the annealed condition to over 1,100 MPa. Precipitation hardening in alloys like aluminum 7075 or stainless steel 17-4 PH works by forming fine precipitates that block dislocation movement. Cold working (plastic deformation at room temperature) increases UTS through strain hardening but reduces ductility. A cold-drawn wire may have 30% to 50% higher UTS than the same alloy in the annealed state.
Defects and Surface Condition
Internal defects like porosity, inclusions, and micro-cracks act as stress concentrators that reduce effective tensile strength. Castings generally have lower UTS than wrought products of the same alloy because of trapped gas porosity and shrinkage voids. Surface scratches, machining marks, and corrosion pitting all create local stress concentrations that can initiate fracture well below the bulk UTS, especially under cyclic (fatigue) loading.
How Tensile Strength Is Measured
The standard test method for metallic materials in the United States is ASTM E8/E8M. A dog-bone-shaped specimen with a precisely machined gauge section is gripped in a universal testing machine and pulled at a controlled rate (typically 0.005 to 0.05 inches per minute for the yield region, then faster to fracture). The machine records force and displacement continuously, producing the raw data that becomes the stress-strain curve.
Key measurements taken from a standard tensile test include the 0.2% offset yield strength, the ultimate tensile strength, the percent elongation at fracture (measured over the original gauge length), and the percent reduction of area at the fracture cross-section. Elongation and reduction of area are ductility measures that complement the strength values. A typical structural steel like A36 shows about 20% elongation, while a high-strength spring steel might show only 5% to 8%.
For plastics, the equivalent standard is ASTM D638, and for composites ASTM D3039. Specimen geometry, grip design, and strain rate requirements differ between material classes because each behaves very differently under tension.
Tensile Strength in Engineering Design
In practice, structural engineers rarely design to the full UTS. Instead, a factor of safety is applied to ensure the structure can handle unexpected overloads, material variability, and degradation over time. Typical factors of safety for static tensile loading range from 1.5 to 4, depending on the application and the consequences of failure.
Structural steel design codes like AISC 360 use both yield-based and rupture-based limit states. For a tension member with bolt holes, for example, the design strength is the lesser of: yielding on the gross section (0.9 times the yield strength times the gross area) or rupture on the net section (0.75 times the UTS times the net area). The lower resistance factor on rupture (0.75 vs. 0.9) reflects the more severe consequence of fracture compared to yielding.
Pressure vessel design (ASME Boiler and Pressure Vessel Code) uses the lesser of one-third the UTS or two-thirds the yield strength as the allowable design stress, whichever controls. This dual check ensures that neither general yielding nor fracture governs at an unsafe margin.
FAQ
Tensile strength (ultimate tensile strength, or UTS) is the maximum stress a material can withstand under uniaxial tension before fracture occurs. It is reported in units of pressure such as megapascals (MPa) or pounds per square inch (psi) and represents the peak of the engineering stress-strain curve.
Yield strength is the stress at which permanent deformation begins, while tensile strength is the maximum stress reached before fracture. For ductile materials, yield strength is always lower than tensile strength. Design codes use both values with different safety factors to ensure structural integrity.
Among bulk engineering materials, ultra-high-strength steels (maraging steels) can reach UTS values above 2,400 MPa. Among fibers, carbon nanotubes have demonstrated tensile strengths above 60,000 MPa in laboratory conditions. For commonly available materials, Kevlar 49 fiber at 3,620 MPa and E-glass fiber at 3,450 MPa rank among the highest.
Yes. Most metals lose tensile strength at elevated temperatures because thermal energy assists dislocation movement. Mild steel at 400 degrees C retains only about 60% to 70% of its room-temperature UTS. However, some austenitic stainless steels actually increase in strength at cryogenic temperatures while remaining ductile.
ASTM E8/E8M is the standard test method for tensile testing of metallic materials. It specifies specimen geometry, strain rate, and reporting requirements. ASTM D638 covers plastics and ASTM D3039 covers fiber-reinforced composite materials.